


The scales we choose for likelihood and consequence constitute a necessary frame of reference for risk assessment. But the specifics of that frame of reference can profoundly influence the results of assessment, even to the extent of entirely dominating it.
Unfortunately, the scales now commonly assumed to be 'best practice' in IT and project risk management typically dominate to such an extent that our assessments fail to reflect the reality of the risks being assessed.
Words fail me
The most egregious example of scale dominance is where verbal categories such as 'high', 'medium', and 'low' are relied on. The fundamental problem is that such terms can mean radically different things to different people. The column graph in figure 1 illustrates this problem. It was plotted from data in a research paper on the interpretation of verbal probability categories used by the IPCC in relation to climate change events, but that doesn't preclude its validity for us in IT as it represents a universal problem.
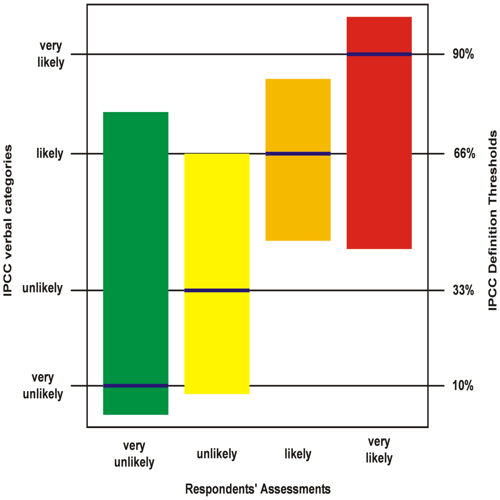
The vertical axis shows four verbal likelihood categories defined by the IPCC and the officially defined probability thresholds associated with them. Each vertical bar represents the range of probabilities assigned to the given verbal category as interpreted by the experimental subjects. The ranges of interpretation of 'very unlikely' (officially 10%, range 3% to 76%) and 'very likely' (officially 90%, range 43% to 99%) overlap by about 50% and entirely encompass the ranges for 'unlikely' (officially 33%, range 8% to 66%) and 'likely' (officially 66%, range 45% to 84%). Clearly, none of these verbal categories convey any consistent information.
Uncertainty of this kind is present wherever verbal categories are used regardless of the specifics being assessed, so it applies to consequence assessment as much as to that of likelihood. It's essentially ineradicable, and is only reduced by use of a cross reference to objective values both at the time of assessment and every time an extant assessment is subsequently interpreted. Which of course renders the use of verbal categories somewhat superfluous.
Less than magic numbers
Even where numerical scales are used for likelihood and consequence, the nature of the chosen scales can dominate assessment. Financial consequence scales using decade order increments (e.g. $10-99, $100-$999 etcetera) are the most widely used, but these increments are too coarse for safety when assessing risk. For example, potential losses of $12k and $95k, although quite possibly having significantly different business impact, will be considered equal, both falling into the $10k-$99k slot on a decade order scale.
Likelihood is also commonly expressed in approximate decade order increments, in this case representing notional event frequency in time (once in 10 years, once a year, once a month and so on), but such scales present two significant problems. Firstly, decade order increments are again too wide. Their use is based on an entrenched belief that likelihood must use identical scale increments to those used for consequence. But this belief results from a purely arbitrary preference for representing the logarithms of likelihood and consequence values on the scales and adding them, rather than representing and multiplying the values themselves.
Obviously, if logarithms are to be added they must have the same base or the result is nonsense, but enforcing decade order increments for both scales results in massive uncertainty. It causes each increment in notional risk (each square of a risk matrix) to represent a 100:1 range of actual risks, all of which are considered to be equal. That's much too wide a range to allow proper prioritisation for management.
Escape from time
The second (and actually overriding) problem with time interval based event frequency scales is that the incidence of many real world risk events does not depend on it. So it's a bad choice as the sole frame of reference for likelihood. But how else to represent it?
Some two and a half centuries ago French mathematician Abraham de Moivre provided a really simple universal definition of probability as the ratio of the number of times an event is expected to happen and the total number of opportunities for it to happen, regardless of the specific basis on which opportunities to happen are defined. So it's a dimensionless fractional number between zero and one (or if you prefer, a percentage from zero to 100). For example, if a brilliant golfer were to score a hole in one on average every 50 drives (each drive being an opportunity to do so), the probability of her holing in one would be 1/50 or 0.02 (2%) and the probability of her missing would be 49/50 or 0.98 (98%). Those probabilities would remain valid while she maintained her handicap regardless of how regularly she played. So in this hypothetical case and a vast number of real cases, the use of time interval based event frequency scales would preclude realistic assessment of likelihood because event incidence actually depends on something else. The trick is to establish what the incidence of any given event does depend on and use that as the basis for its probability assessment.
Reliance on a time based likelihood scale also has a psychological hazard. A common unconscious error when using such scales is to tacitly assume that the clock starts ticking at the point of assessment, so a 'once in ten years' event may be considered irrelevant when assessing risk for a one year project
For you
Be part of something bigger, join BCS, The Chartered Institute for IT.
In reality, even in cases where event incidence does depend on time interval, the clock runs continuously and the notional frequency is only an approximate long term average anyway, so the 'once in ten years' event might actually occur today. Actually, the probability of it occurring today would be more informative than just 'once in ten years', and that's what de Moivre's definition can provide us with. On that basis, assuming regular occurrence, the probability of a 'once in ten years' event occurring on any given day would be approximately 1/3652 or 0.027%.
Runaway ranges
Another common error when defining likelihood and consequence scales is failure to connect with reality in respect of their overall ranges and the resulting range of represented risk. The five point scales and resulting nine point range of results of the typical exponentially scaled matrix in figure two seem at a glance to be compact and linear, but what they represent is not. It's really five decade orders on each scale.
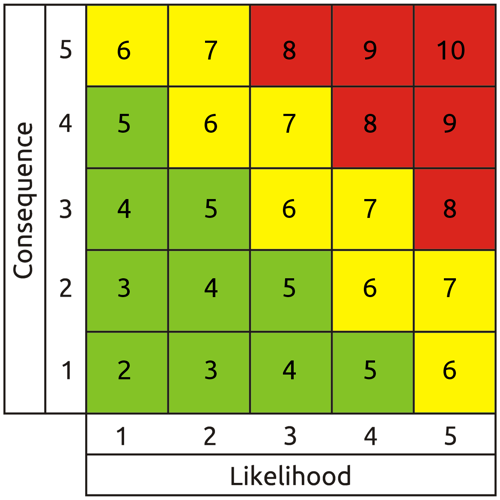
The resulting ten billion (105 X 105) to one range of risk represented by the entire matrix is so vast as to be essentially meaningless. If the maximum risk level were relevant, risk levels a very long way above scale minimum would be so trivial they would be economically unmanageable, and if the minimum were relevant, the organisation would likely be wiped out by events with risk levels a long way below scale maximum. The maximum realistic range of manageable risks for most organisations is unlikely to exceed 10,000 to one, and is usually somewhat less.
So scales for both likelihood and consequence should be defined with ranges and combined results that accurately reflect the organisation's real risk profile. Likelihood should preferably be expressed on a linear scale (as defined by de Moivre), e.g. zero to 100%, representing probability at the point of assessment. The basis for the divisor should be the nature of opportunities for occurrence of each specific event (not just universal reliance on time interval whether relevant or not). For consequence, a 'one size fits all' absolute monetary scale for the entire enterprise may be too wide. Numerically comparable losses to different departments or functions of a more than minimally complex organisation could have differing significance to the conduct of business. So, for example, we might consider proportional impact scales that take into account the varying detriment of given risk events to different business processes. But whatever their specific basis, both scales need realistic ranges and sufficient resolution to allow proper prioritisation of risks for individual treatment, rather than yielding — as is currently prevalent — a small number of huge heaps of undifferentiated risks that are erroneously assumed to have equal significance.
Whys, wherefores and ways forward
The primary source of all the failings discussed here is that, despite being quite elementary, the knowledge and skills needed to avoid them are not being taught. Risk assessor training in general closely follows the content of formal risk management standards, but therein lies a snag. Inevitably, the content of these standards represents a periodic consensus of current most common practice. Much of that common practice may pass muster, but in the specific case of risk assessment it has for some 40 years been deficient, particularly in the ways described here. Apparently simple methods drawn from narrowly context specific standards such as US MIL-STD-882B have been progressively but inappropriately applied in wider contexts, despite more generally applicable if more arduous methods being available. As their defects are now embedded in common practice, they have become enshrined in standards. They consequently persist as apparently authoritative guidance that drives training and thus common practice and in turn the content of standards in a self-reinforcing loop.
To break out of this loop we must take a completely fresh look at the way risk assessment is taught and conducted, where necessary bypassing the guidance of current standards and returning to first principles. We must take into account the individual characteristics of real world risk events, replacing generic rule-of-thumb methods with a robust analytical approach, reliance on evidence and challenge to assumptions. In fact, we must adopt the rigorous mind set used in science and critical systems engineering. It is used in those disciplines because it delivers accurate, repeatable results that stand up to verification. Which is of course what we too should be aiming for, because risk assessment that does not reflect reality is not just pointless — it's dangerous. Your greatest risk is putting trust in unreliable risk assessments.
About the author
Mike Barwise is a veteran information risk management consultant with a background in systems engineering. He has contributed to national and international risk management standards development and is keen to collaborate with fellow experts in improving the realism of information risk management and practitioner training. Mike can be contacted at mbarwise@intinfosec.com