The overall UK figures
At a glance: The headlines 2021 for all ethic minorities
- The six million individuals from ethnic minorities of working age in the UK accounted for 15% of the working age population - 13% of those in work
- Ethnic minority representation was higher amongst IT specialists than within the workforce as a whole - 19% versus 13%
- There were 360,000 ethnic minority IT specialists in the UK
- Ethnic minority IT specialists were twice as likely to be working in non-permanent positions as their white counterparts (6% versus 3%)
- Approximately 10,000 unemployed IT specialists were from ethnic minority groups – which accounted for 40% of all
- In 2021, ethnic minority IT specialists (full-time employees) were earning the same as IT specialists as a whole, with median hourly rates in each case of £22phr
- Ethnic minority IT specialists were as likely to be in ‘positions of responsibility’ as those of white ethnicity with 38% and 39% respectively stating that they were a manager or team leader in 2021
- Amongst ethnic minority IT specialists 86% have an HE level qualification, compared to 68% of those from white ethnic groups
At a glance: Representation by sex
- There were 424,000 female IT specialists in the UK workforce during 2021 - 22% of the total at that time
- The level of female representation in IT has increased marginally over the past five years though by an increasing rate since 2019
- Female representation remains well below the level observed within the workforce as a whole (48%)
- Scotland displayed the best ‘gender balance’, with women accounting for 32% of IT specialists
- At £19 per hour, the median hourly earnings for female IT specialists in 2021 was 13% less than that recorded for males working in IT positions (as employees)
- Women remain very poorly represented amongst IT directors (just 17% of which in 2021 were female) and programmers/software developers (16%)
Figure 4
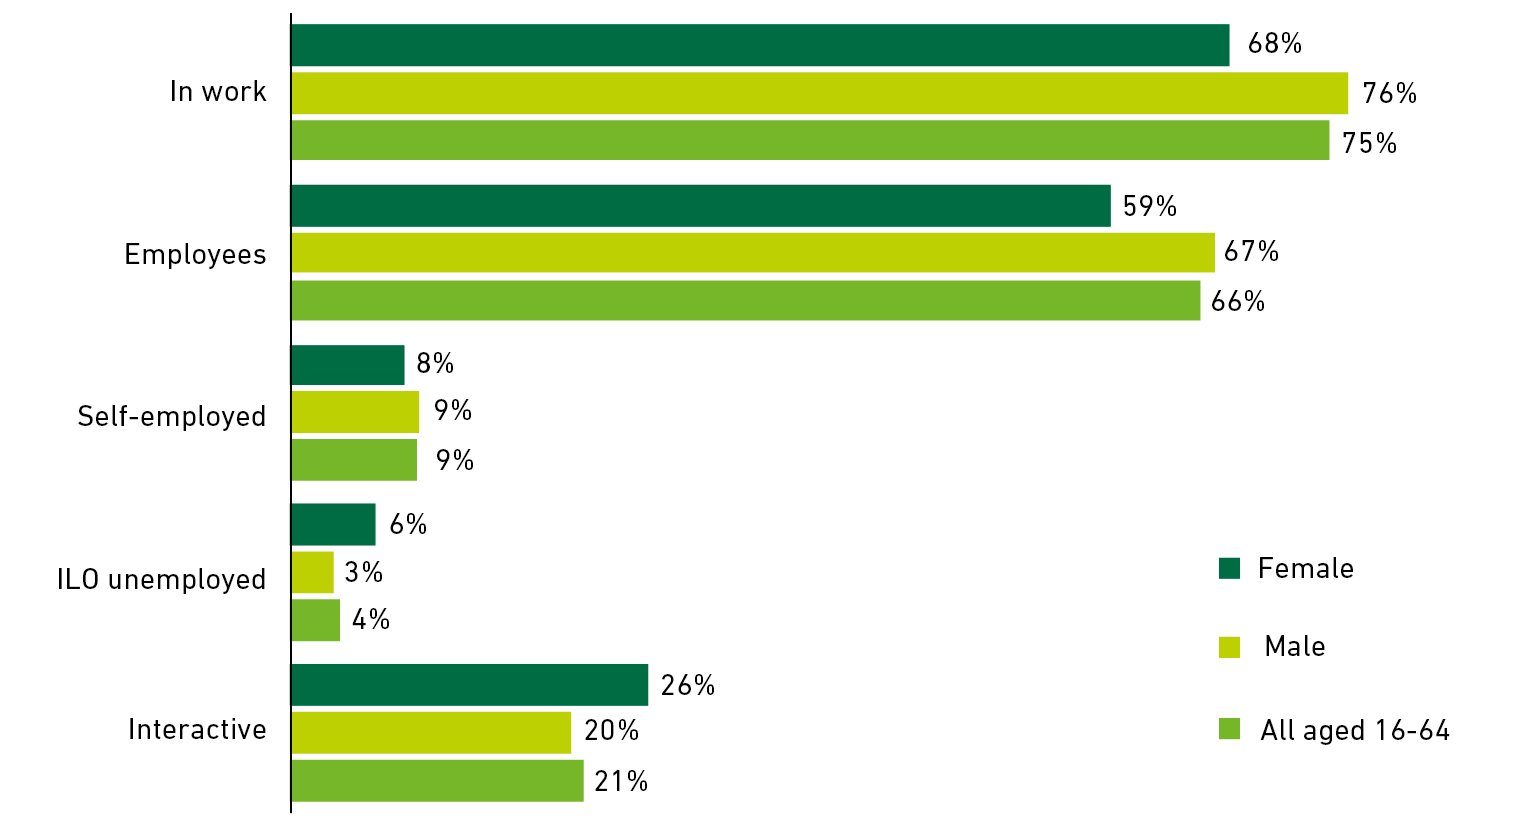
Source: Analysis of ONS Quarterly Labour Force Survey by BCS * includes a small number of individuals in work but not as employees/self-employed (i.e. <1% of the total). Note: ILO unemployed is International Labor Organization definition
Given that they accounted for 15% of the working age population, the proportion of individuals in work accounted for by ethnic minority groups was slightly lower than would be expected (13%) as was the case for employees (13%) and the self-employed workers (13%).
The level of representation for ethnic minority groups was much higher when considering individuals that were either unemployed (i.e. 25% of the total) or economically inactive (18%).
IT employment
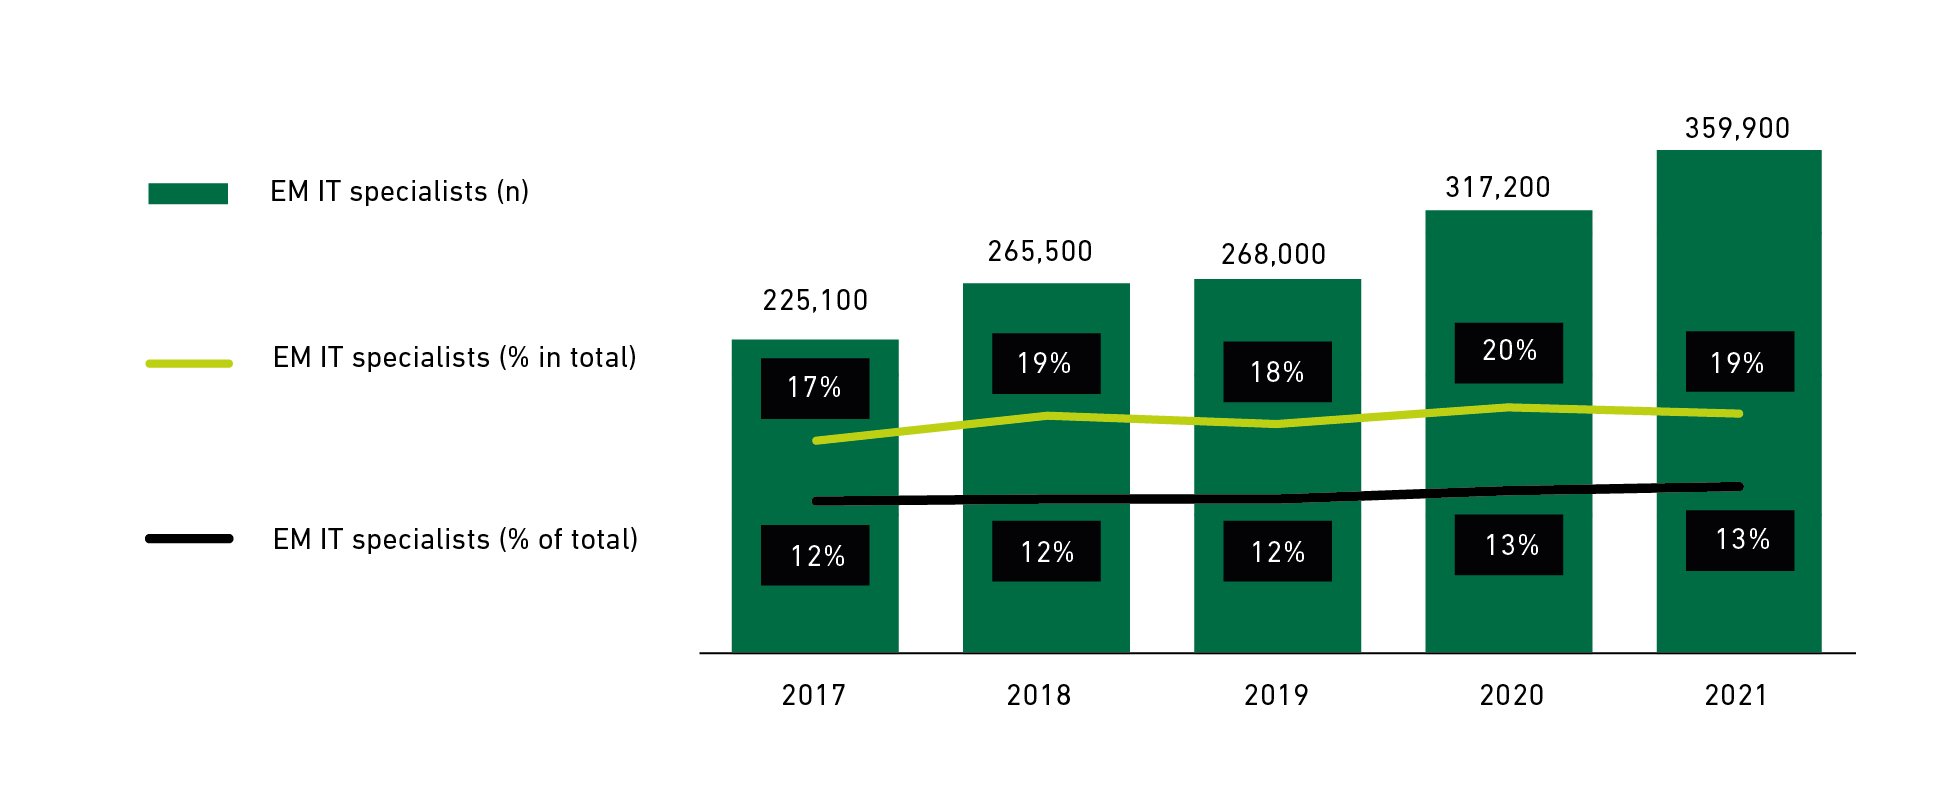
There were 360,000 IT specialists in the UK from ethnic minority (EM) groups in 2021, representing 19% of all IT specialists in the UK at that time – a notably higher level of representation than for the workforce as a whole (13%). Moreover, the level of ethnic minority representation amongst IT specialists has remained consistently above the norm throughout the past five years as illustrated in the chart below:
Figure 5: Trends in workforce representation (2017-21)
Click to expand image
Source: Analysis of ONS Quarterly Labour Force Survey by BCS.
Ethnicity in IT explored
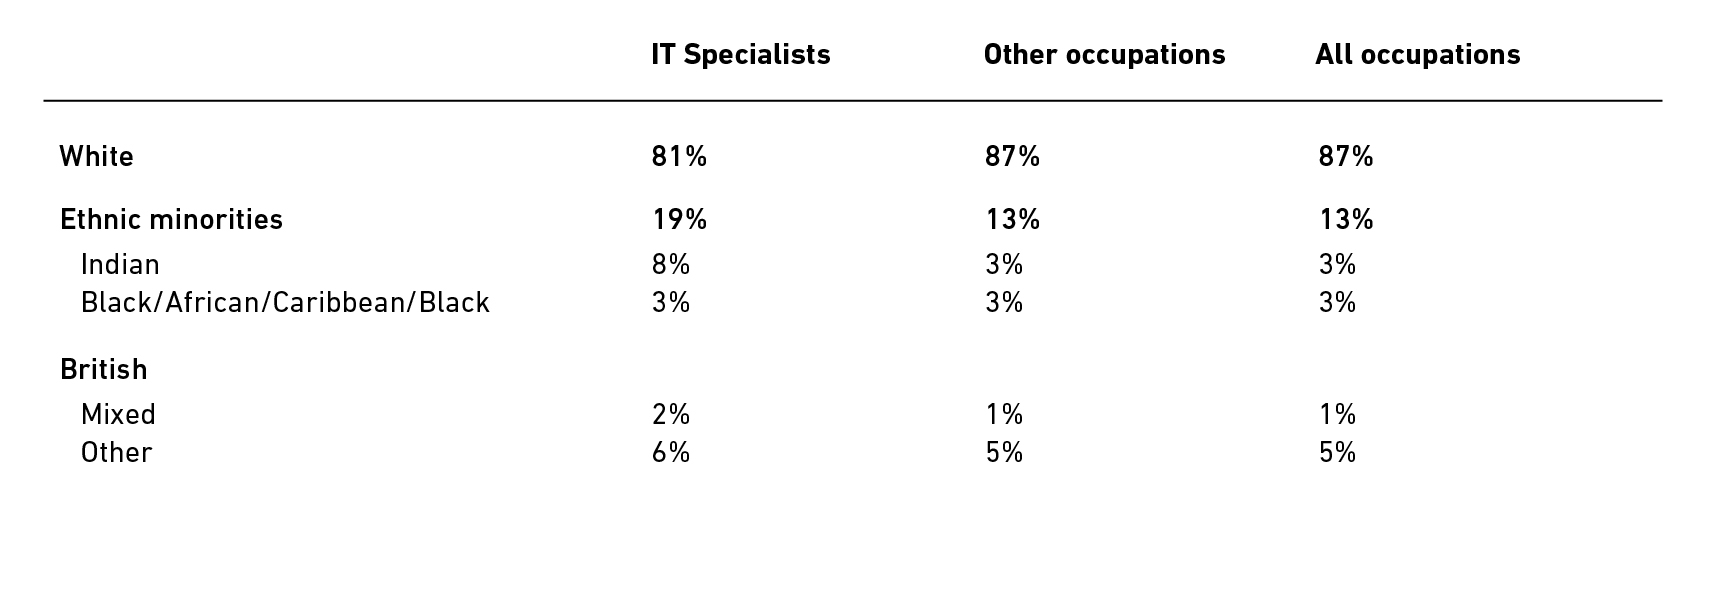
Amongst IT specialists from ethnic minority groups, representation is highest for those whose ethnicity is Indian (8%) – this group almost three times as prominent amongst IT specialists as within the workforce as a whole (3%) in 2021.
Figure 6: Ethnicity in the workforce (2021)
Click to expand
Source: Analysis of ONS Quarterly Labour Force Survey by BCS.
Representation across the UK
Representation of individuals from ethnic minority groups amongst the IT professions varies significantly across the UK - from just 5% in Wales to 36% in London. Within all nations / regions however, the proportion of IT specialists from ethnic minority groups is higher than that recorded within the workforce as a whole for that area of the UK (i.e. during 2021).
Figure 7: Workforce representation by nation/region (2021)
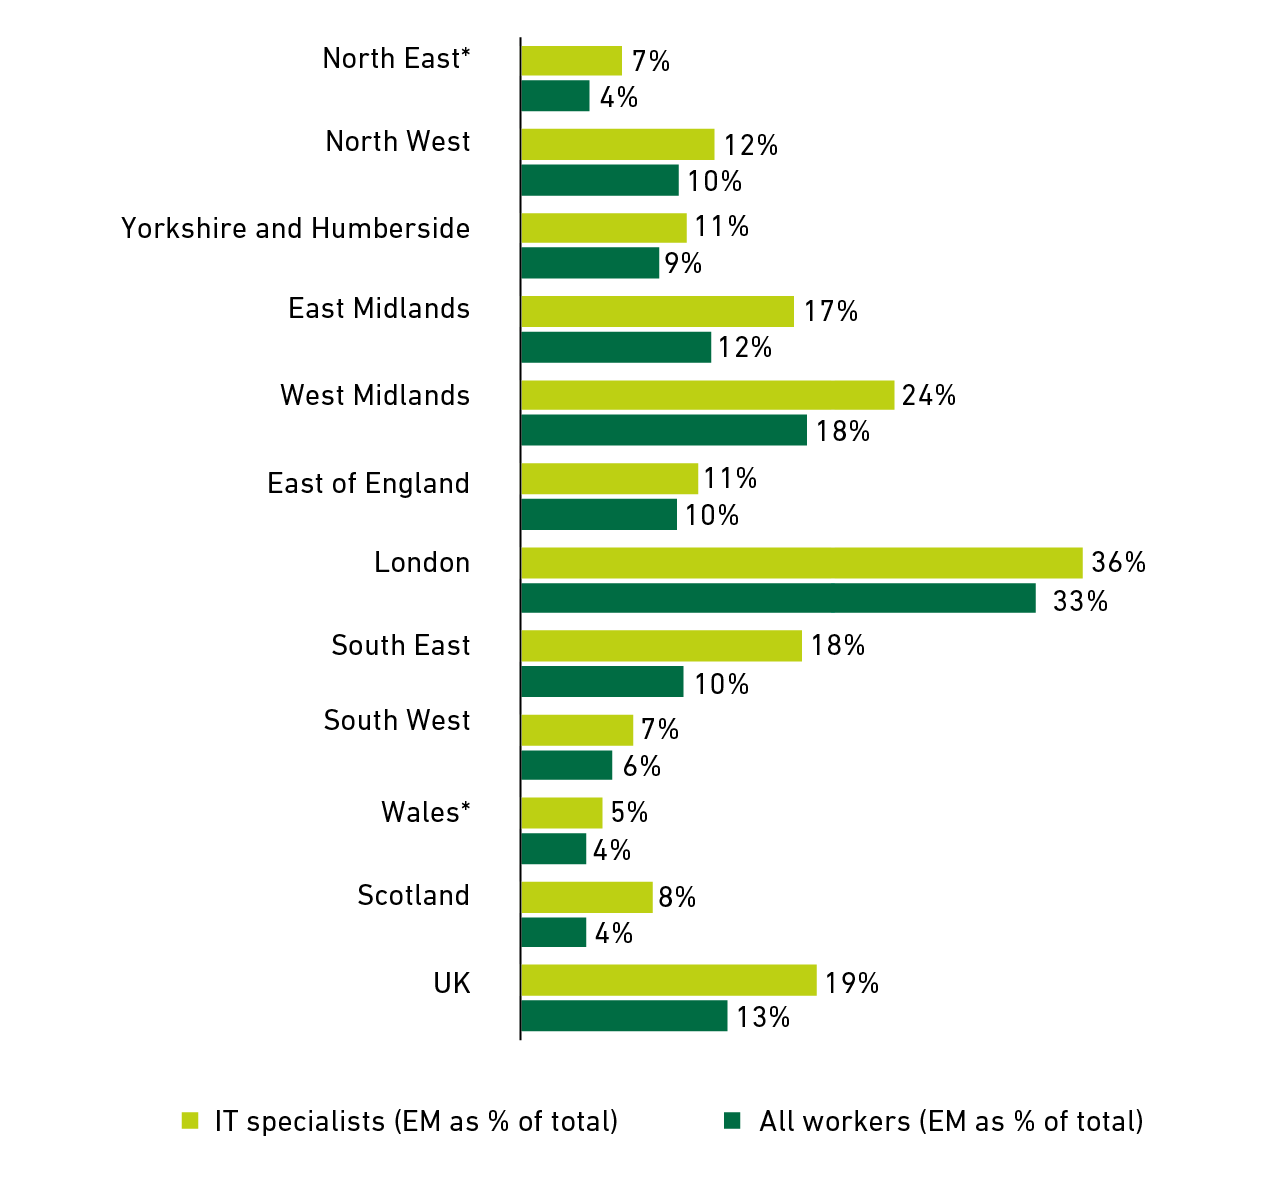
Source: Analysis of ONS Quarterly Labour Force Survey by BCS
* Five-year average
Employment roles
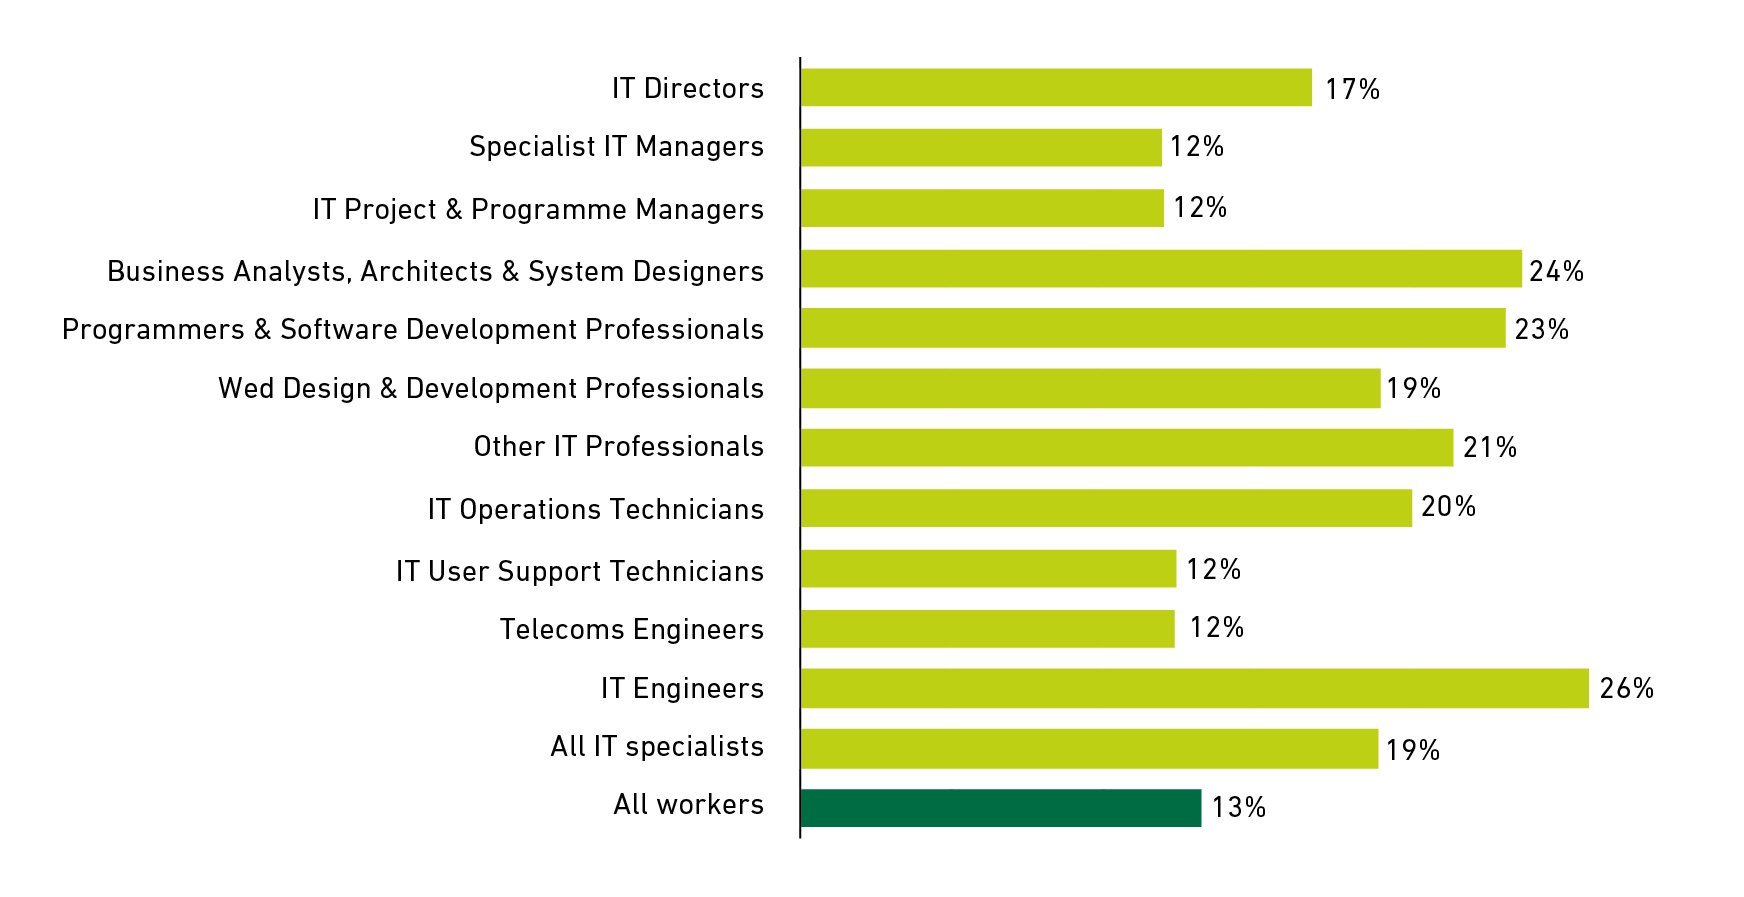
Ethnic minority representation amongst IT specialists in 2021 ranged from just 12% of specialist IT managers, IT project / programme managers, IT user support technicians and telecoms engineers – to 26% of IT engineers and 24% of IT business analysts.
Figure 8: Ethnic minority representation by IT occupation (2021)
Click to expand image
Source: Analysis of ONS Quarterly Labour Force Survey by BCS
Permanency of employment
Overall, 4% of IT specialists in the UK were working on a non-permanent basis in 2021, whilst for IT specialists from ethnic minority groups the figure was twice the level of those from a white background at 6%. By comparison, the proportion of ethnic minority workers as a whole in non-permanent employment during the year was still higher at 9%.
Though a detailed analysis of the reasons why IT specialists (white/ ethnic minority) were in non-permanent employment during 2021 is not possible due to limitations of the data source, it can be said that ethnic minority IT specialists are marginally less likely to be in temporary positions as they cannot find a full-time job - with just under one quarter (23%) of ethnic minority IT specialists in such roles stating this to be the case during the 2017-21 period compared to a full quarter (25%) of those IT specialists classed as ‘white’. Other factors that could also have a bearing here are the effects of the COVID-19 on the labour market in general and, for self-employed IT specialists, the changes to the IR35 legislation.
Unemployment
There were approximately 10,000 unemployed IT specialists from ethnic minority groups in the UK during 2021 – 40% of all unemployed IT specialists in the UK at that time.
At 2.8% the associated unemployment rate1 for IT specialists from ethnic minority groups was notably higher than that of their white counterparts (1.6%) though well below the overall unemployment rate for the ethnic minority workforce of the UK (8.2%).
Pay and responsibility
Full-time and part-time working
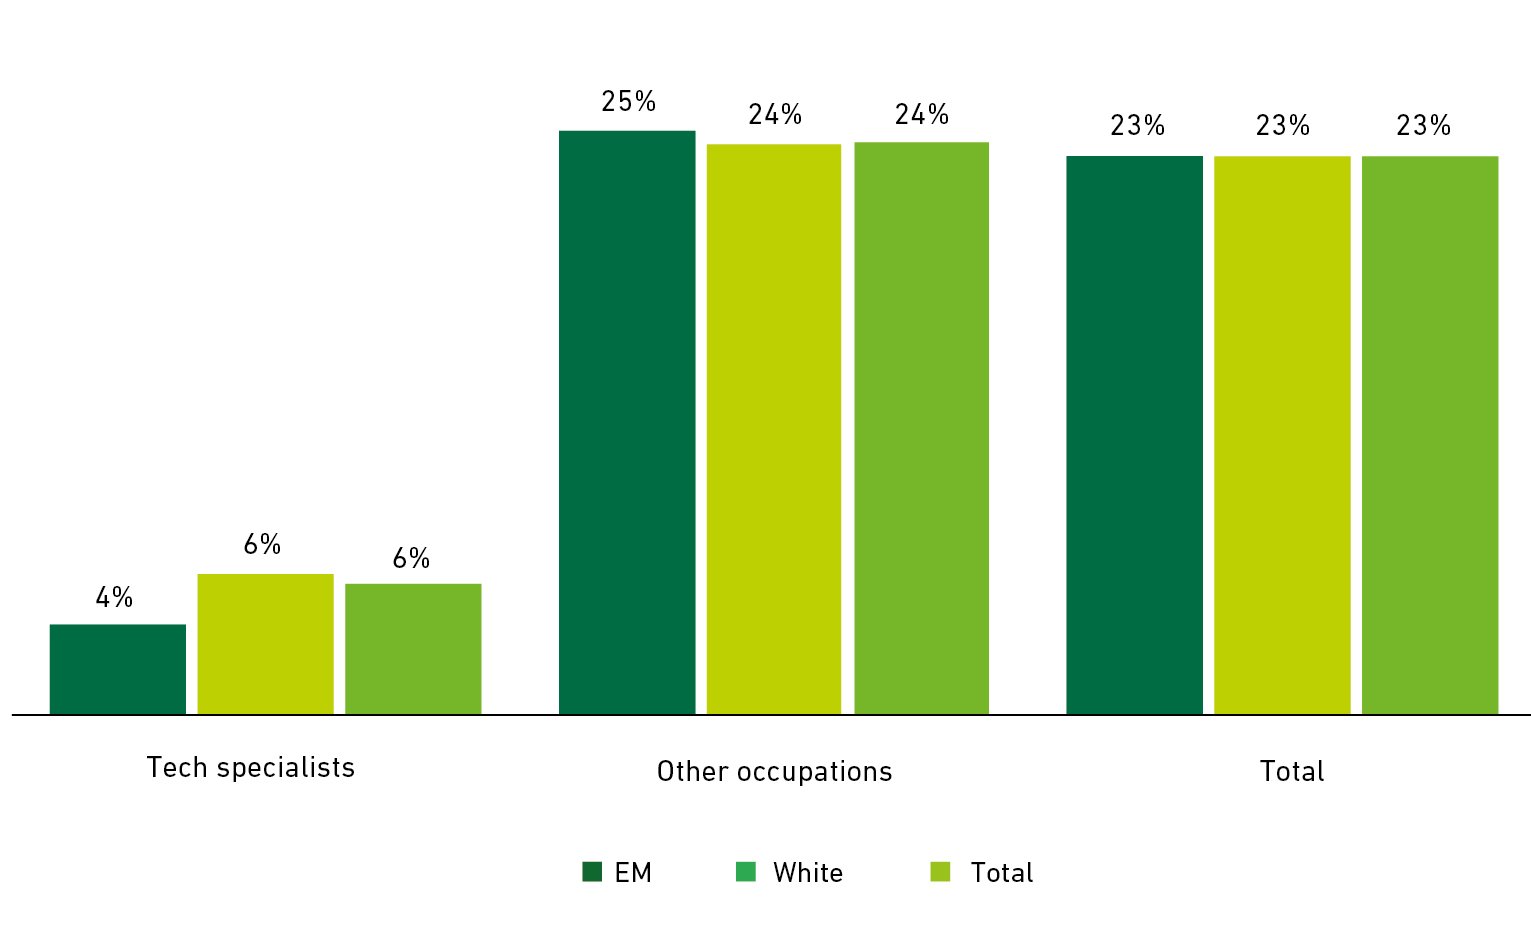
IT specialists in the UK are much less likely to work part-time than other workers, and in 2021, just 6% were working part-time hours compared with 23% of workers as a whole. Moreover, ethnic minority IT specialists appear even less likely to be working in part-time positions (just 4% in 2021).
When asked why they were working part-time, the majority of part-timers stated that it was because they did not want a full-time job (68% of all workers and 79% of IT specialists) though the likelihood of this being the case amongst ethnic minority workers was much lower (55% in each case).
Figure 9: Incidence of part-time working (2021)
Source: Analysis of ONS Quarterly Labour Force Survey by BCS
Remuneration
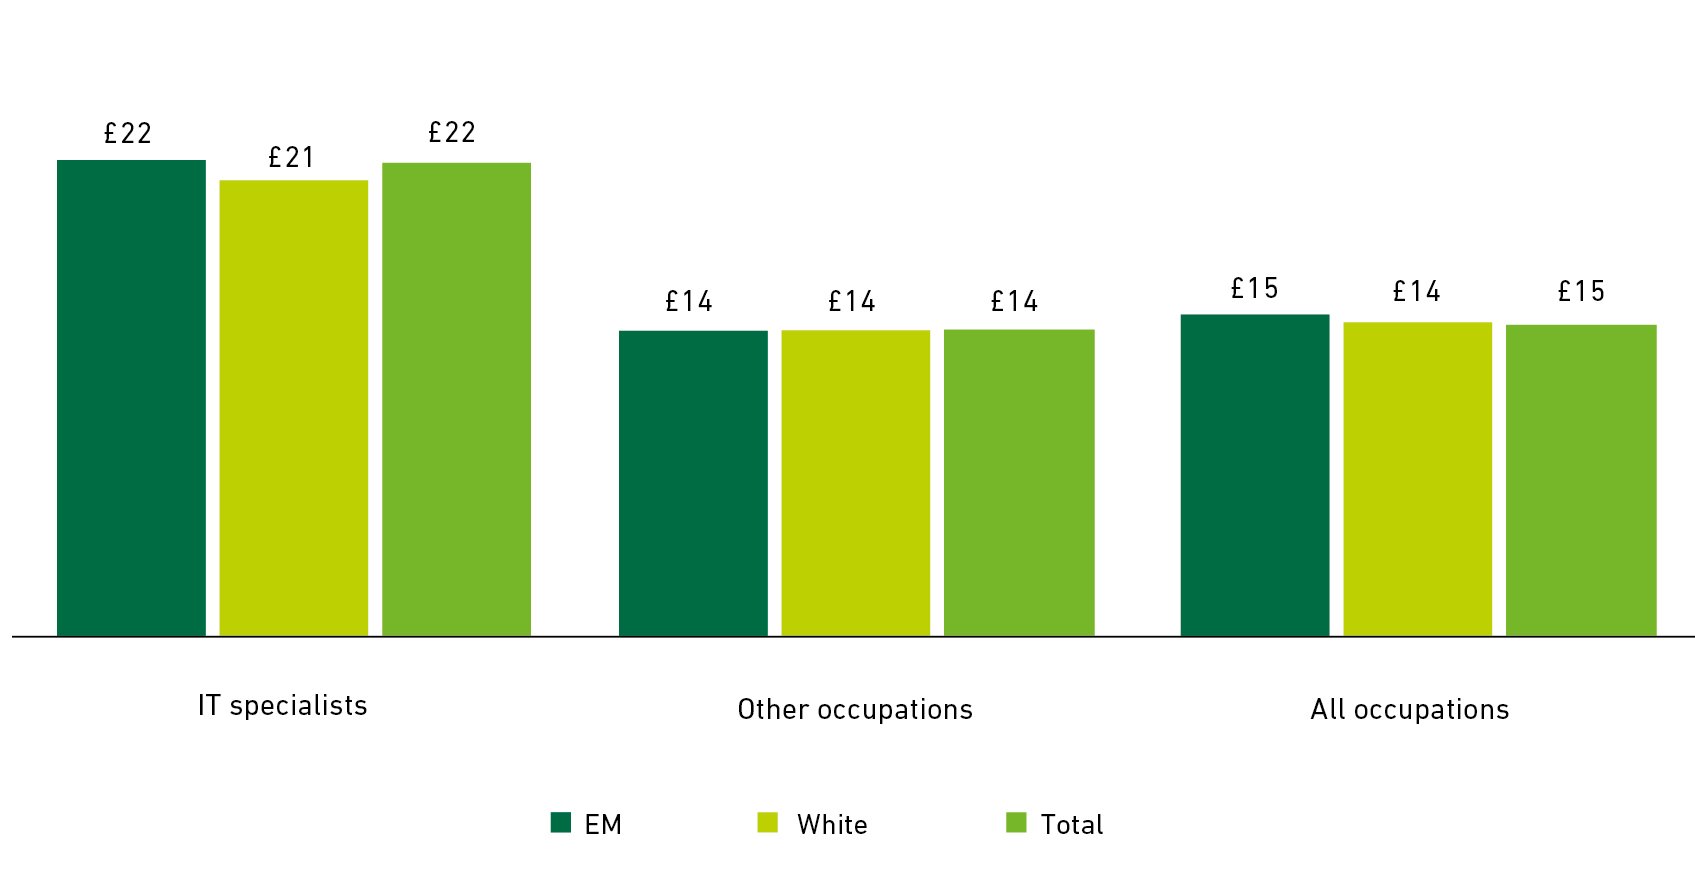
In 2021, the median hourly earnings recorded for ethnic minority IT specialists working in the UK stood at £22 per hour – a level equal to that for IT specialists as a whole and 48% higher than that for all ethnic minority workers in the UK at that time (£15 per hour)2
6% of IT specialists work part-time hours compared with 23% of workers as a whole.
Figure 10: Median hourly earnings of full-time employees (2021)
Source: Analysis of ONS Quarterly Labour Force Survey by BCS
Responsibility
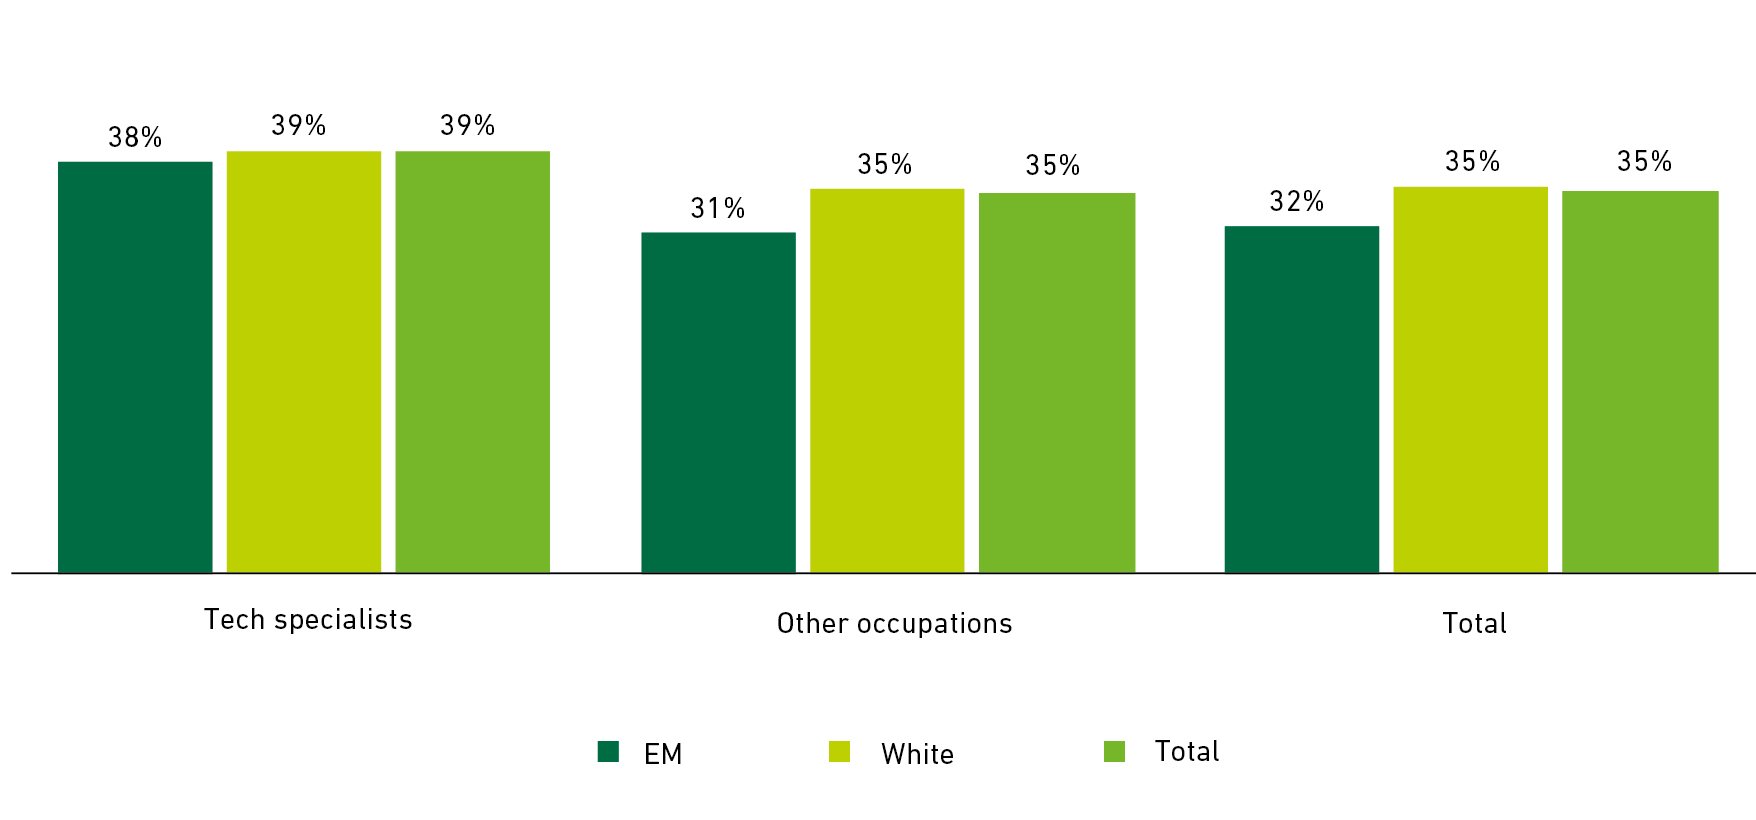
Using managerial / supervisory status as a proxy for the likelihood that individuals are given responsibility within their work, it would appear that during 2021, ethnic minority IT specialists (that were employees) were marginally less likely to be in ‘positions of responsibility’ than their white counterparts with 38% and 39% respectively stating that they were a manager / foreman or team leader.
In both cases the likelihood of individuals holding positions of responsibility was higher than others in the workforce amongst which comparison figures of 32% and 35% respectively were recorded.
Figure 11: Employees in 'responsible positions' (2021)
Source: Analysis of ONS Quarterly Labour Force Survey by BCS
Skills
Qualifications held
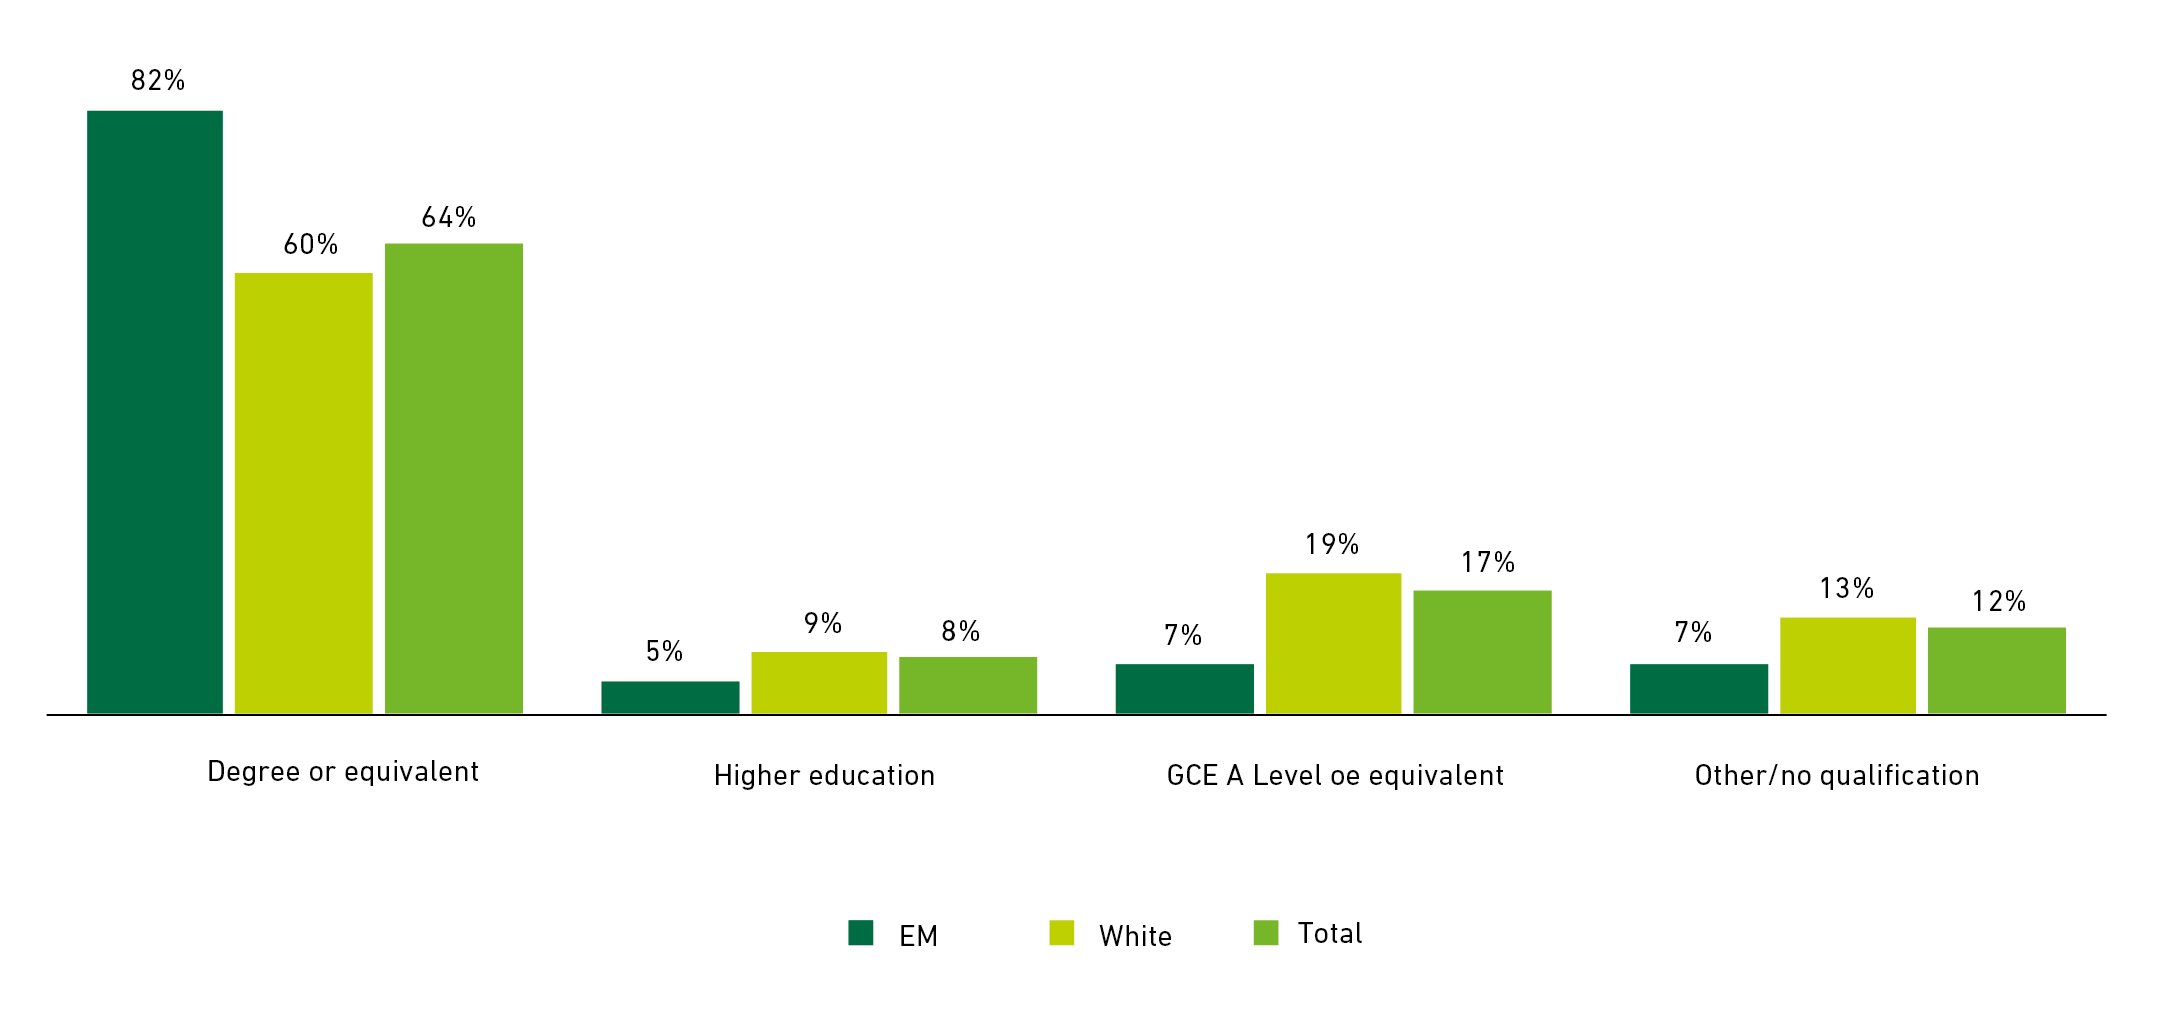
IT specialists are more highly qualified than other UK workers, and in 2021, more than two thirds (72%) were thought to hold some form of higher-level qualification, compared with just under five in ten workers as a whole (50%). This said, ethnic minority IT specialists were found to be even more highly qualified than others in IT positions with almost nine in ten (86%) holding some form of HE level qualification.
Figure 12: Level of educational attainment amongst IT specialists (2021)
Click to expand image
Source: Analysis of ONS Quarterly Labour Force Survey by BCS
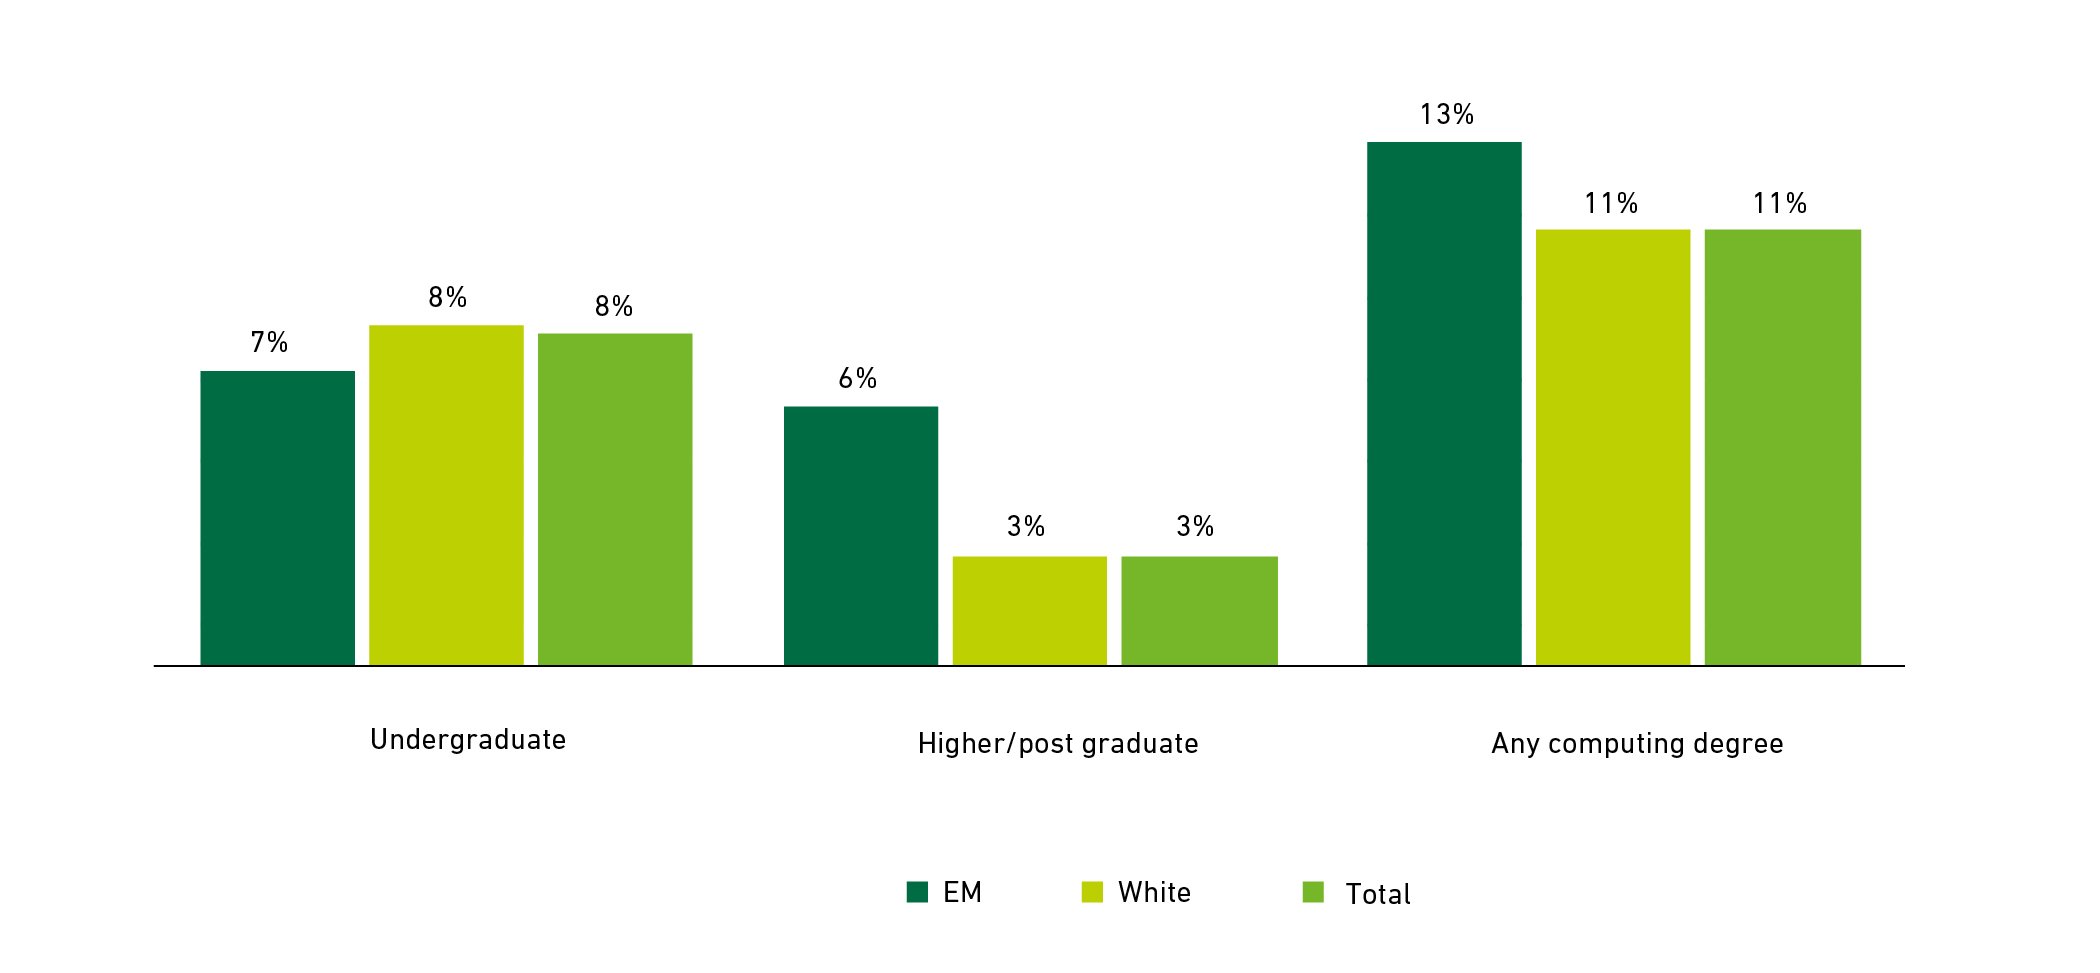
Ethnic minority IT specialists are also marginally more likely to hold a degree in an IT-related discipline than others working in such occupations, and in 2020, approximately 13% were thought to have either a higher or undergraduate computing degree compared with 11% of IT specialists from white ethnic groups.
Figure 13: IT specialists holding computing degrees (2021)
Click to expand image
Source: Analysis of ONS Quarterly Labour Force Survey by BCS
Skills development
Despite the arguably high skill / knowledge requirements associated with their work, IT specialists as a whole in the UK do not appear any more likely than other workers to receive job-related education/training and, throughout 2021, on average 26% of IT specialists stated that they had received some form of job-related education/training in the previous 13 weeks, as was the case for workers as a whole.
The incidence of job-related education/training was marginally higher amongst ethnic minority IT specialists in 2021 - 28% of which stated that they had received education/training during the previous 13 weeks when surveyed compared with 26% of those with ‘white’ ethnicity.