


Age in context, labour market overview
There were 13m people aged 50 and above in the UK in 2021, representing just under one third (31%) of the total working age population at that time.
Of these, 71% were in work, 26% were classed as ‘inactive’ and 3% were unemployed (compared with figures of 77%, 19% and 4% respectively for individuals of working age that were aged 16-49).
Age and economic activity of the working aged population (2021)
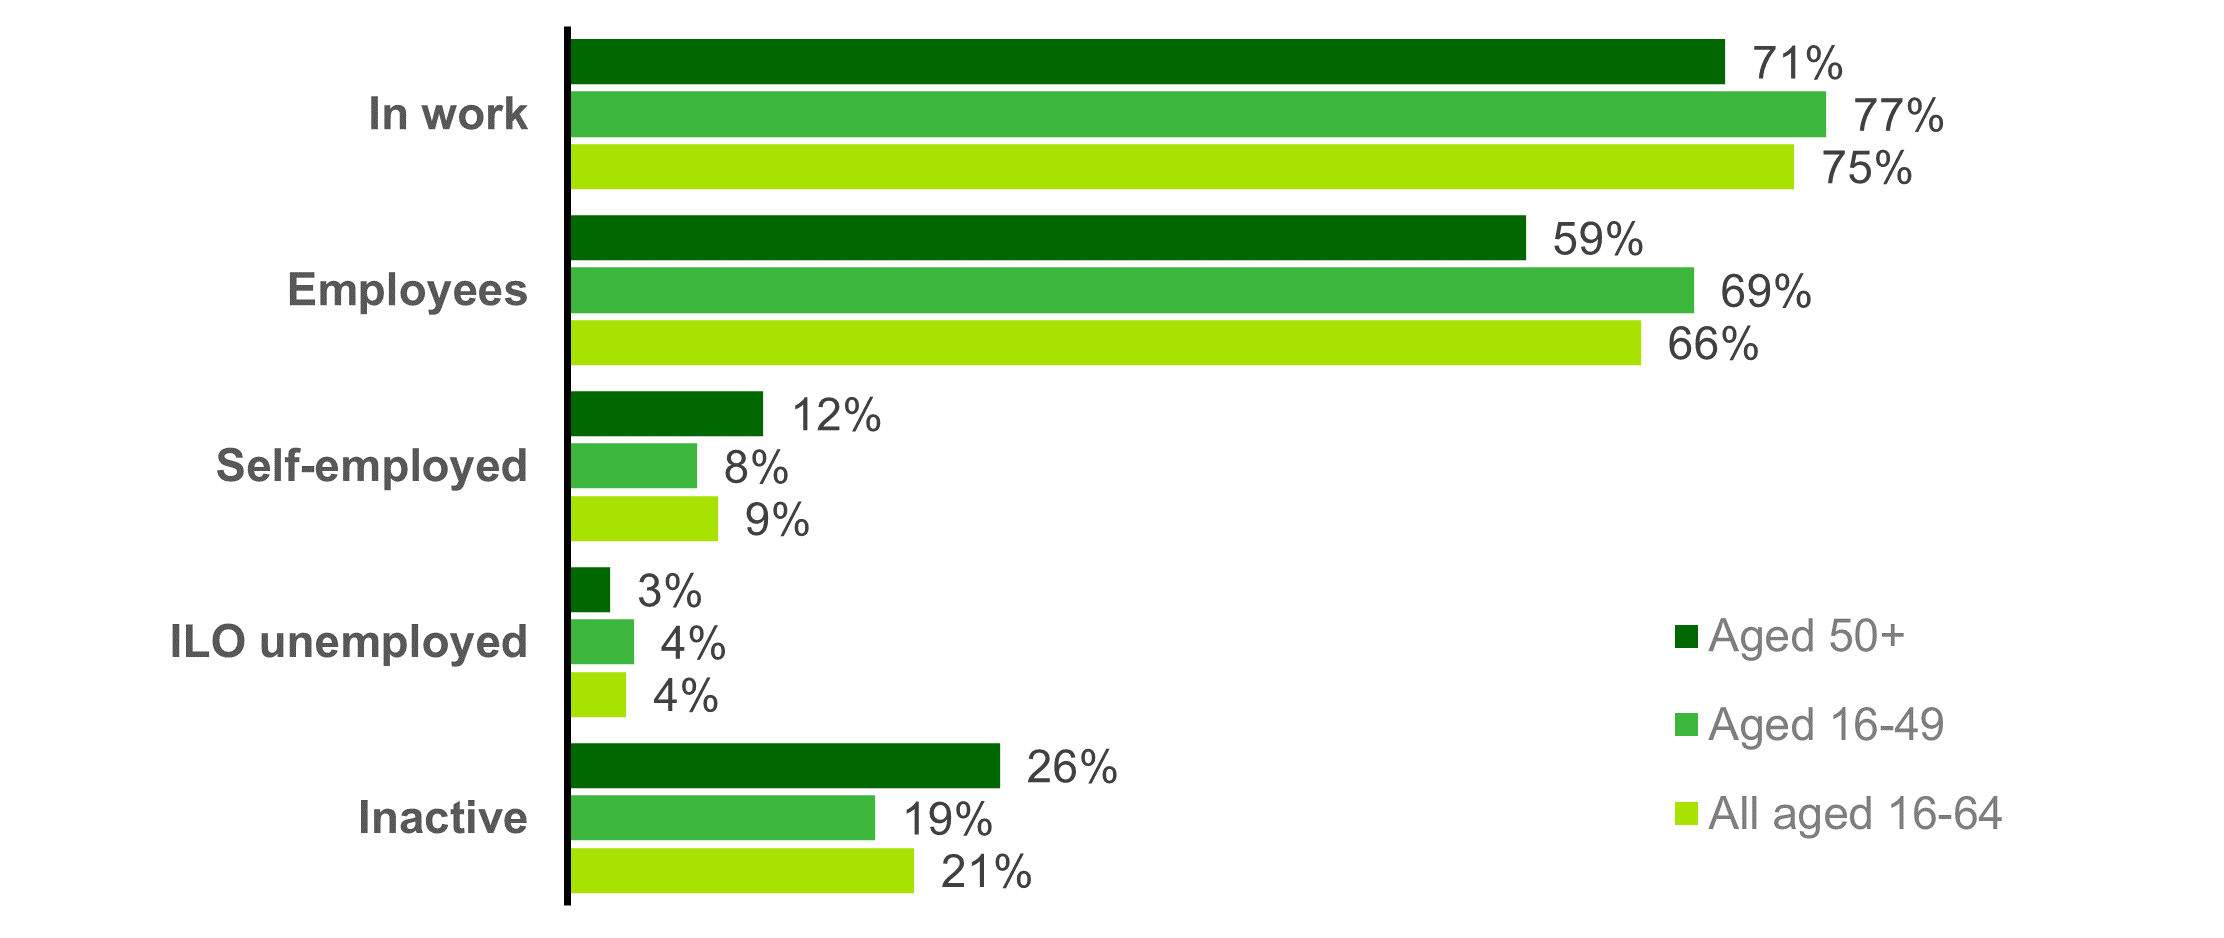
Source: Analysis of ONS Quarterly Labour Force Survey by BCS
* includes a small number of individuals in work but not as employees / self-employed (i.e., <1% of the total)
The level of representation for individuals aged 50 within the workforce was marginally lower during 2021 (30%) whilst ‘older workers’ accounted for a much lower proportion of the unemployed – 23% in this case.
When considering individuals that were inactive however, those aged 50 and above accounted for almost four in ten (39%) of the inactive population during 2021 – this high level of representation due largely to the above average proportion that were retired from work.