


Employment characteristics
Self-employment
In 2021, there were approximately 126,000 self-employed IT specialists in the UK, representing 9% of the total at that time. The incidence of self-employment amongst female IT specialists however was half this level (6%) and half the level recorded by women in the workforce as a whole (also 12%).
Gender and the incidence of self-employment (2021)
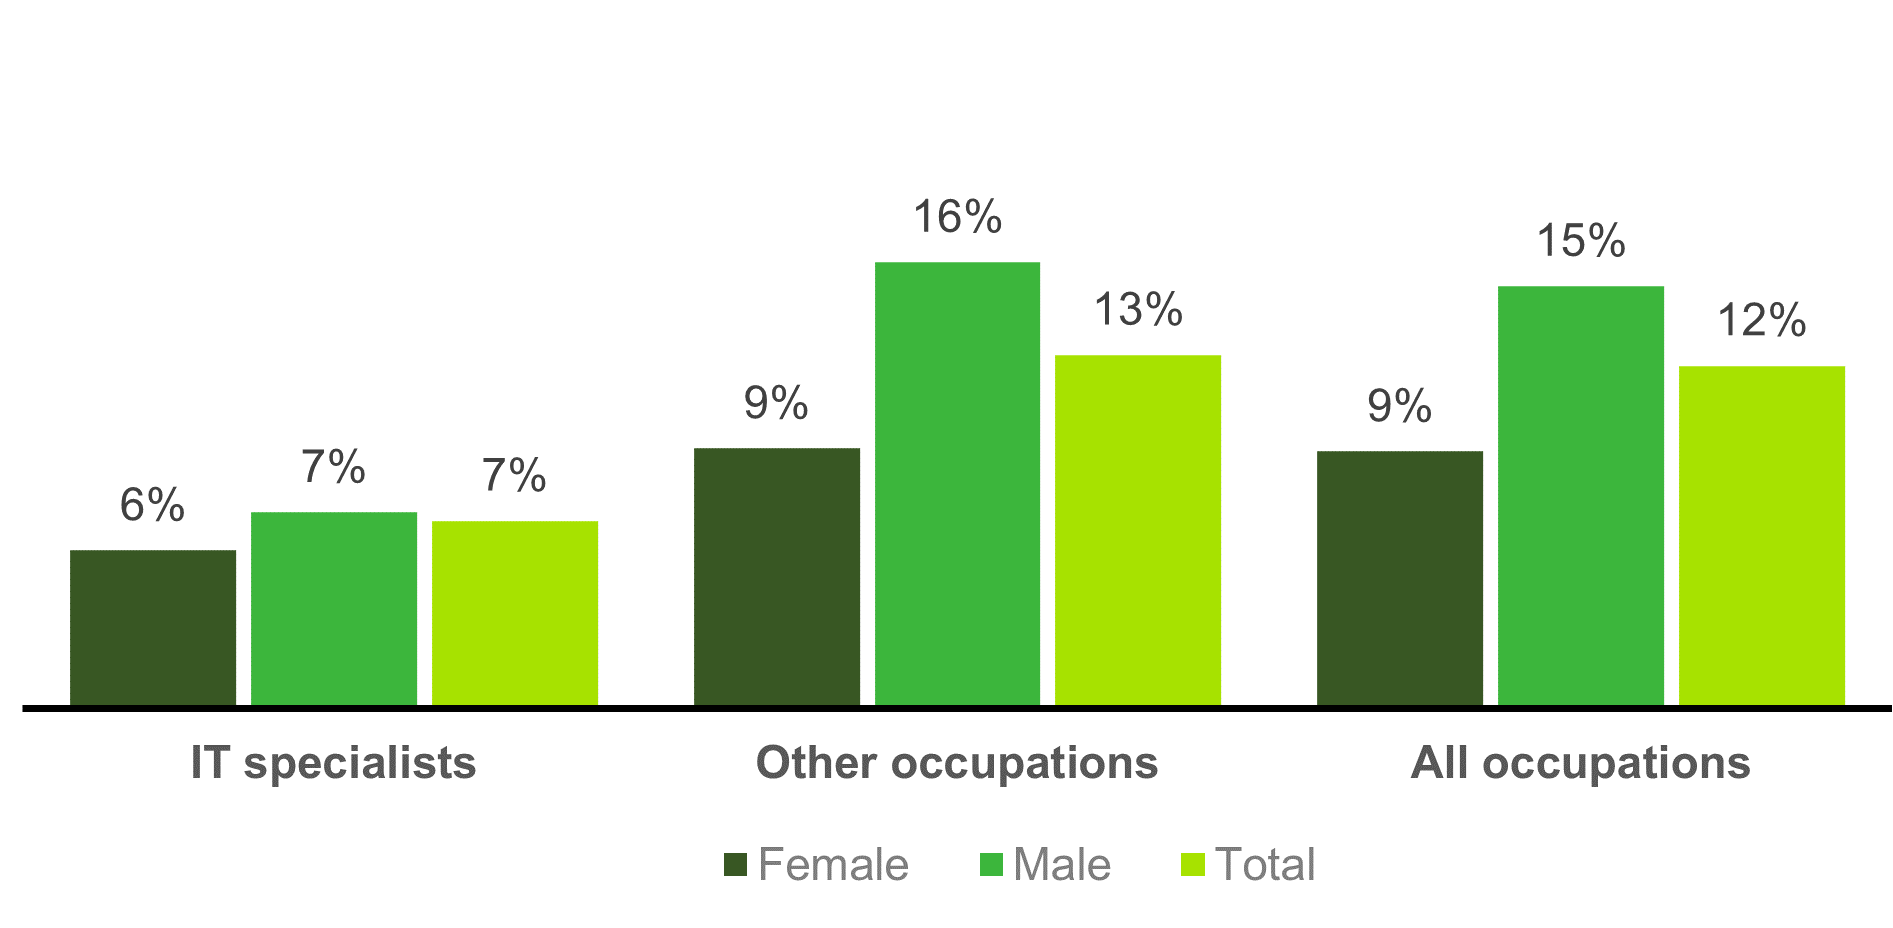
Source: Analysis of ONS Quarterly Labour Force Survey by BCS
Employees and size of workplace
IT specialists working as employees are, perhaps understandably, more likely than others to be employed within larger workplaces[2] (i.e. as micro / small sites are less likely to have an in-house function) and whilst just 29% of UK employees as a whole were working in larger sites during 2021 (those with 250 or more staff), a figure of 44% was recorded for IT specialist employees.
There was little difference in the proportion of female vs male IT specialists working in large sites in 2021 – 45% compared with 43% over the year on average.
IT specialist employees by sex and size of workplace (2021)
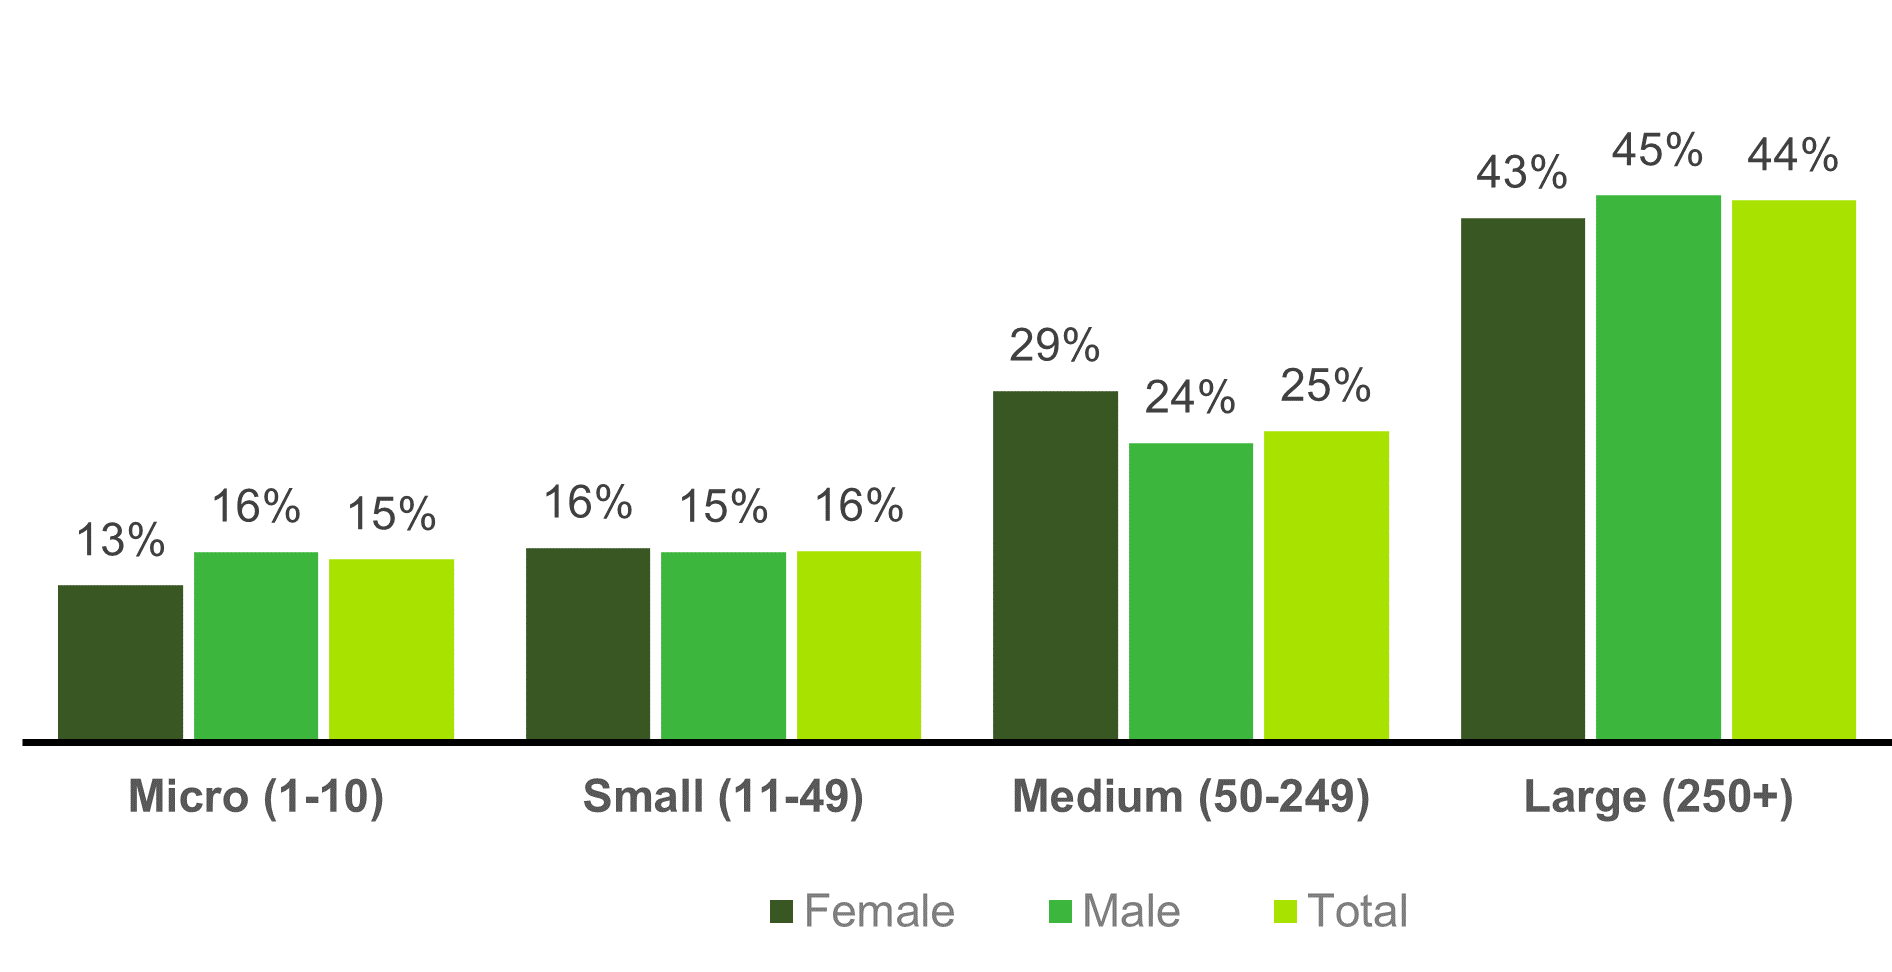
Source: Analysis of ONS Quarterly Labour Force Survey by BCS
Industry of employment
After IT, the next largest employer of IT specialists (male or female) were banking/finance (25% of female IT specialists and 24% of IT specialists as a whole), and the public sector (20% and 15% respectively).
Looking in more detail at the levels of representation for female IT specialists in different industries in 2021, it can be seen that representation was highest in the energy/water, the public sector and transport/communications with figures of 35%, 29% and 28% respectively.
Conversely, the construction sector along with the IT industries were shown to have the worst gender balance with regards IT specialists – in this case the levels of representation for women in IT positions being 17% and 18% respectively.
Female employees by occupation and industry (2021)
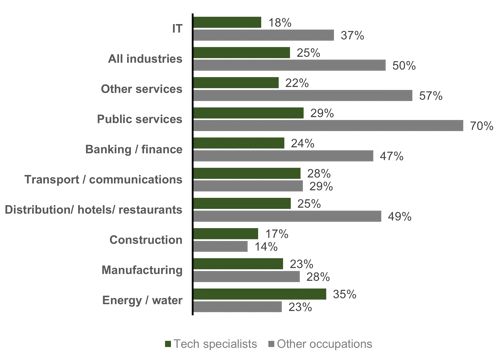
Source: Analysis of ONS Quarterly Labour Force Survey by BCS
* Five-year average
[2]The LFS asks individuals about the number of employees at their workplace as opposed to enterprise/organization as a whole.