


Working hours and benefits
Full-time and part-time working
IT specialists in the UK are much less likely to work part-time than other workers and in 2020, just 5% were working part-time hours compared with 24% of workers as a whole. Moreover, ethnic minority IT specialists appear even less likely to be working in part-time positions (just 4% in 2020).
When asked why they were working part-time, the majority of part-timers stated that it was because they did not want a full-time job (69% of all workers and 82% of IT specialists) though the likelihood of this being the case amongst ethnic minority workers was much lower (56% and 76% respectively).
Incidence of part-time working (2020)
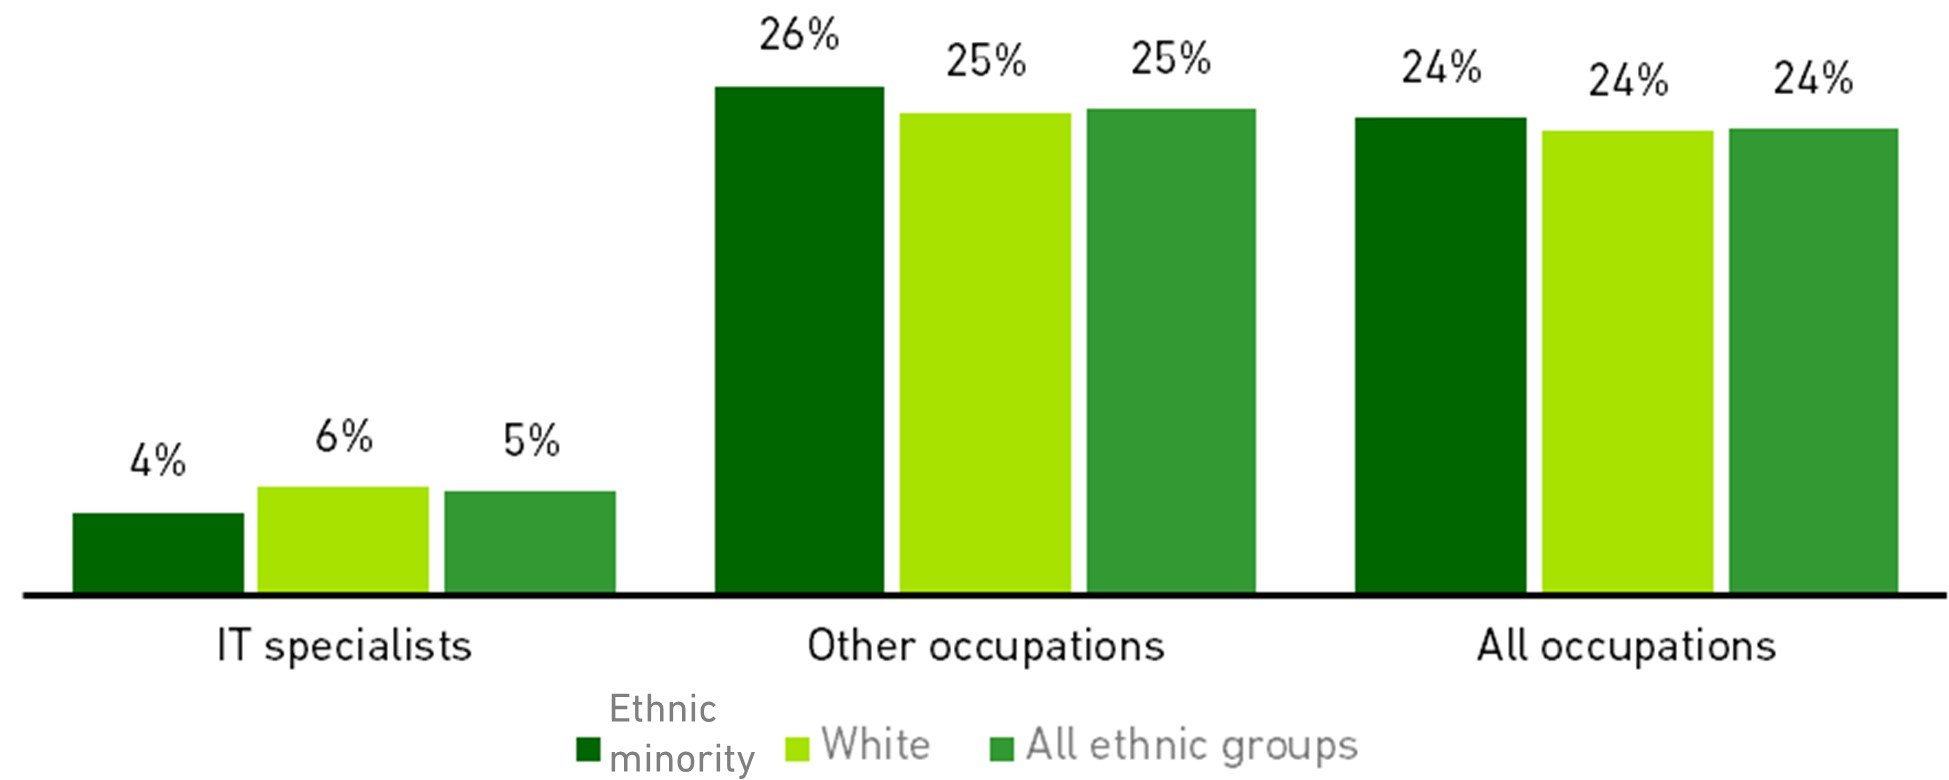
Source: Analysis of ONS Quarterly Labour Force Survey by BCS
Remuneration
In 2020, the median hourly earnings recorded for ethnic minority IT specialists working in the UK stood at £21 per hour - a level equal to that for IT specialists as a whole though 43% higher than that for all ethnic minority workers in the UK at that time (£15 per hour)[3]
Median hourly earnings of full-time employees (2020)
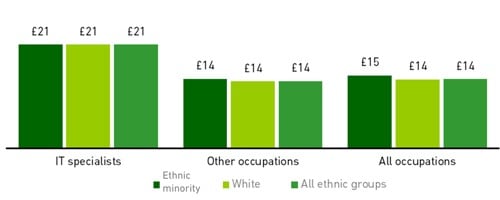
Source: Analysis of ONS Quarterly Labour Force Survey by BCS
Responsibility
Using managerial / supervisory status as a proxy for the likelihood that individuals are given responsibility within their work, it would appear that during 2020, ethnic minority IT specialists (who were employees) were less likely to be in ‘positions of responsibility’ than their white counterparts, with 37% and 41% respectively stating that they were a manager / foreman or team leader.
In both cases, the likelihood of individuals holding positions of responsibility was higher than others in the workforce, amongst which comparison figures of 34% and 37% respectively were recorded, as shown in the chart below.
Employees in 'responsible positions' (2020)
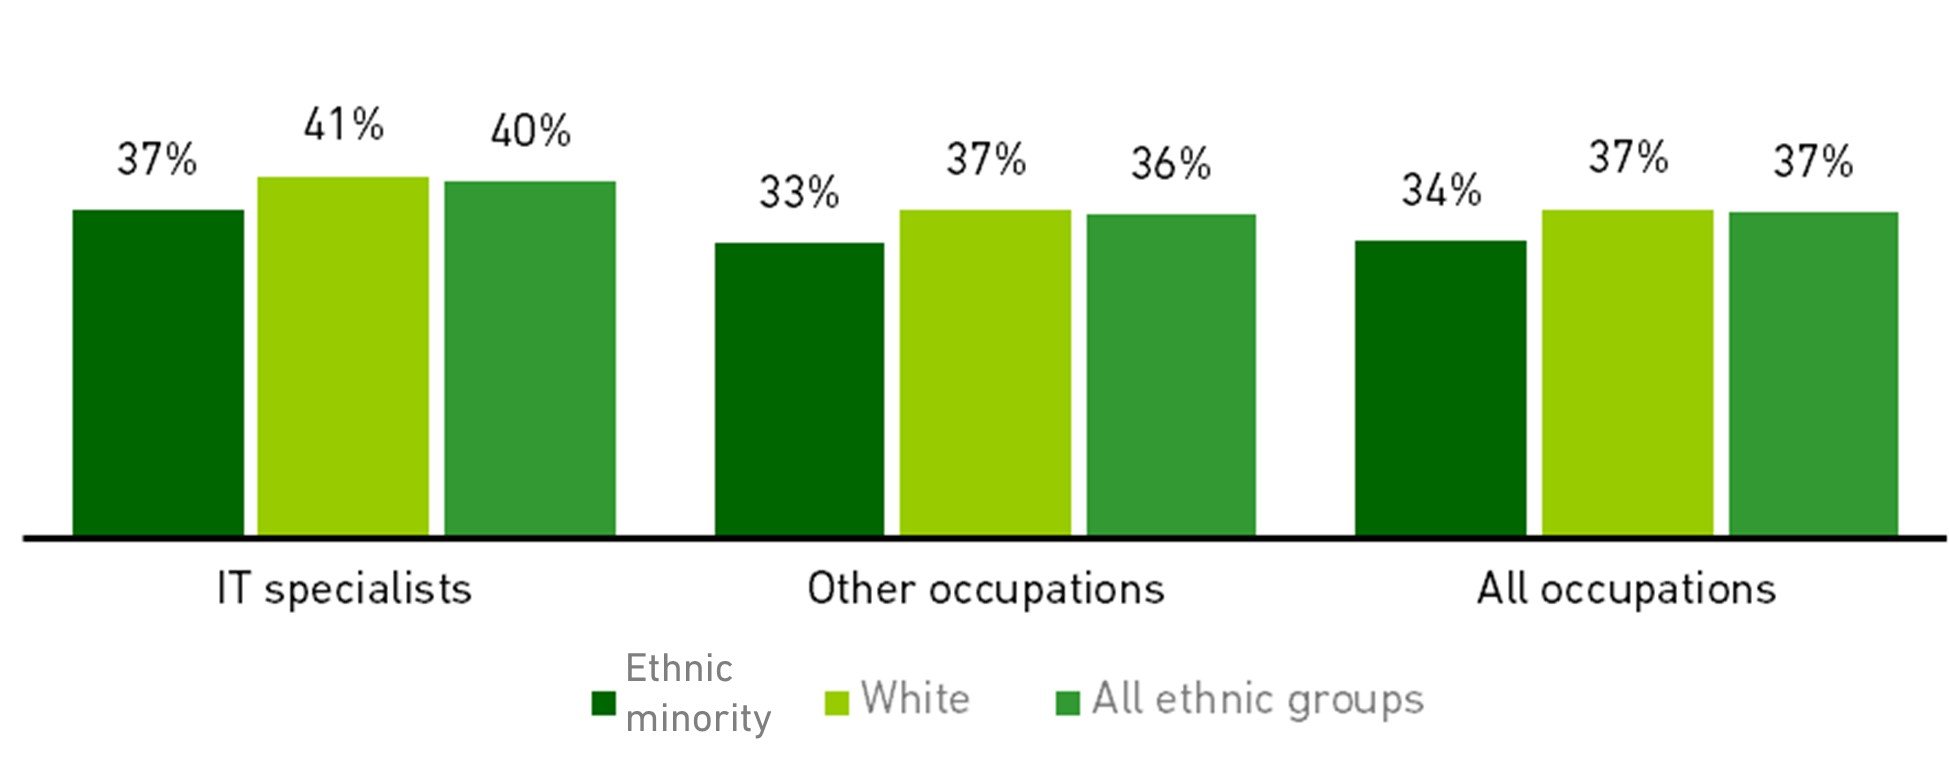
Source: Analysis of ONS Quarterly Labour Force Survey by BCS
[3]All figures given are for full-time permanent employees.