







Gender in context: labour market overview
There were 22m women in the UK aged between 16 and 64 in 2025 - representing 51% of the ‘working age’ population at that time. Amongst women of this age group, 72% were in work, 24% were classed as ‘inactive’ and 4% were unemployed (compared with figures of 78%, 18% and 4% respectively for working age males).
ECONOMIC ACTIVITY OF THE WORKING AGED POPULATION (2025)
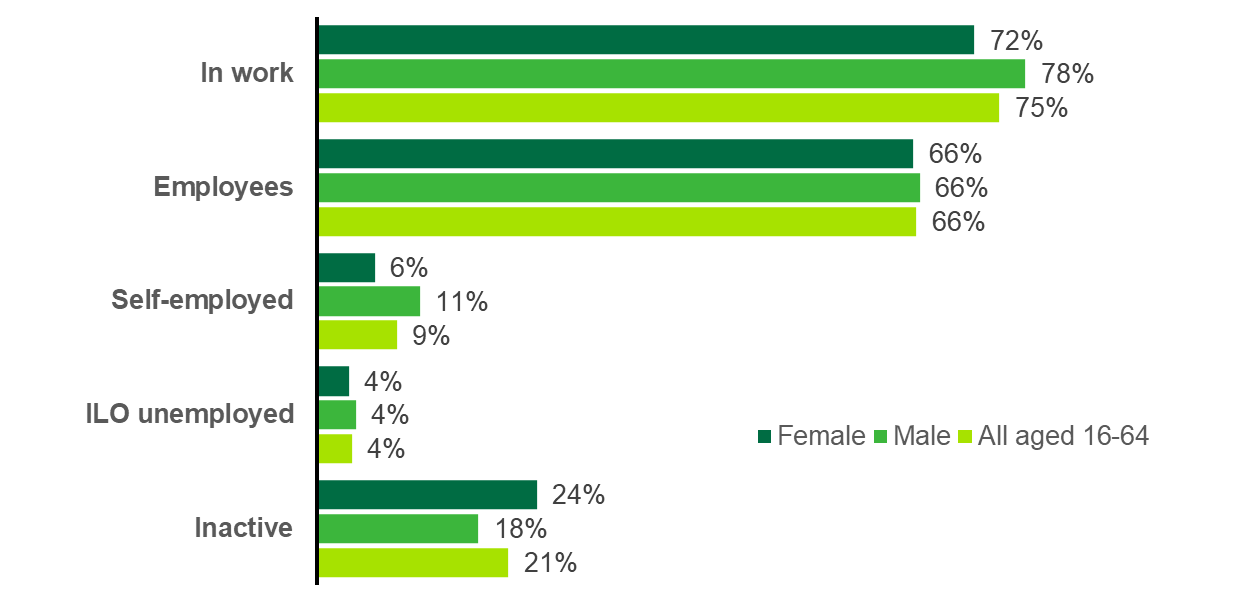
Source: ONS Quarterly Labour Force Survey, analysis commissioned by BCS
*includes a small number of individuals in work but not as employees/self-employed (i.e. <1% of the total)
Overall, the level of female representation within the workforce was slightly lower than would be expected (i.e. accounting for 49% of those in work compared with 51% of the population), and this was also the case when considering representation amongst the unemployed at that time – women in this case accounting for 46% of the total.
By contrast in 2025, women were seen to account for a higher proportion of the inactive population (58%).