There has been much said about Brexit during the last weeks and months, what with government's Brexit bill going through Parliament, job losses being flagged in the aerospace, automotive and banking sectors, together with skills shortages being highlighted by the farming industry.
In addition to all this there was the re-revelation that EU citizens and their families will apparently, be able to cement their ‘settled status’ by coughing up £65 and answering three simple questions on their mobile phone - or via a ‘an alternative digital route’ should they be owners of that relatively unknown brand within government circles called ‘iPhone’.
But moving away from corporate preference for a moment and concentrating on the impact of Brexit in our own domain - IT - just what has been the effect of Brexit to-date, and, more specifically in this blog, how has the social make-up of the IT labour market changed since that fateful day in June 2016 (if at all) and how does this compare with the rest of the economy?
Where are we now?
Latest stats from the LFS show there were 1,375,000 people working in the UK as IT or ‘tech’ specialists during the first quarter of the year, of which 186,000 or 14% were not UK nationals - a slightly higher proportion than that recorded for the workforce as a whole (11%).
This was a much lower proportion than associated with certain occupations, notably 'packers, bottlers, canners and fillers’ amongst whom more than 59% were found to be of non-UK nationality during this period.
Proportion of non-UK nationals in tech versus other occupations
| Tech specialists | |
| Programmers & software developers | 19% |
| Other tech specialists | 19% |
| IT specialist managers | 12% |
| Business analysts, architects & systems designers | 12% |
| IT operations technicians | 11% |
| IT project & programme managers | 14% |
| IT user support technicians | 10% |
| IT & telecommunications directors | - |
| Web design & development professionals | - |
| Telecommunications engineers | - |
| IT engineers | - |
| All tech specialists | 14% |
| Others (highest % of non-UK nationals) | |
| Packers, bottlers, canners & fillers | 59% |
| Food, drink & tobacco process operatives | 44% |
| Natural & social science professionals | 35% |
| Fork-lift truck drivers | 33% |
| Butchers | 32% |
| Chefs | 31% |
| Routine inspectors & testers | 29% |
| Metal working machine operatives | 28% |
| Actuaries, economists & statisticians | 28% |
| Higher education teaching professionals | 27% |
| Childminders and related occupations | 26% |
| All workers | 11% |
Source: BCS analysis of ONS Labour Force Survey data, Q1.18
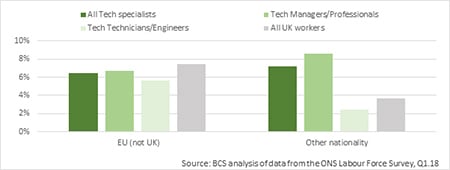
That said, Brexit isn’t about non-UK nationals but about UK versus EU workers and, in this respect the tech workforce is actually associated with a lower level of ‘external representation’ than that registered amongst the labour market as a whole. In Q1.18 just 6% of tech specialists were thought to be EU nationals (88,000 people) compared with 7% of workers more generally. So, tech specialists, though more likely than other workers to be non-UK nationals, are in such cases more likely to have originated from outside of the EU, particularly if they hold ‘managerial/professional positions’.
Where have we come from?
Interestingly enough, despite the uncertainty brought about by the whole Brexit affair, the overall proportion of tech specialists in the UK that are non-UK nationals has changed little since the third quarter of 2016. This is also true for those with EU nationality in particular (excluding the UK of course) - the proportion in this case rising from 6% to 7% between Q3.16 and Q1.18.
That said, this apparently meagre rise in EU representation does equate to an increase of some 9,000 people - a notable gain given that there was a 5% fall (6,000 people) in the number of tech specialists from other parts of recorded over the period and a 1% fall (17,000 people) in the overall number of tech specialists working in the UK.
Proportion of tech specialists with EU (non-UK) nationality
Where are we going to?
At this point it would be customary to follow up with a short summary about what the future holds with regards representation of EU nationals / other tech specialists in the UK. But, given the current levels of uncertainty around the Brexit process itself, the right to remain and the current changes to the work permits system, it would seem that it is perhaps anyone’s guess at this stage.
That said, we may well be experiencing a short term surge in the number of developers, or at least developers with experience of iOS, app development and basic project management skills!
Written by Peter Hounsome of Sagacity Research