Rachel Steenson FBCS, Market Engagement Manager at Esri Ireland, explains the principles behind GIS and how it is used to visualise the data landscape.
Just what is GIS? Wikipedia states that GIS or a Geographic Information System is a system designed to capture, store, manipulate, analyse, manage and present data. An easier way to think of it is, ‘everything happens somewhere’, and GIS allows us to visualise the relationship between the 'what' and 'where'. By understanding this relationship of 'what' and 'where' we can solve complex problems, make better decisions and even save lives.
The birth of GIS
The first example of linking the 'what' with 'where' takes us all the way back to 1854 and a cholera outbreak. At the time, people believed that the disease was being spread through the air. But an enterprising English Doctor, Dr Jon Snow wasn’t convinced. So, he decided to map the outbreak locations, the roads and the property boundaries and the water pumps. And, when he did, he made a startling discovery. A pattern emerged. This pattern proved that the disease was not in fact airborne but was being communicated via water and even more specifically by one infected water pump. John Snow’s cholera map was a major event connecting the what with the where.
Not only was this the beginning of spatial analysis, it also marked a whole new field of study: Epidemiology, the study of the spread of disease. Snow’s work demonstrated that GIS is a problem-solving tool. He put the what on a map to show the where and a made a life-saving discovery.
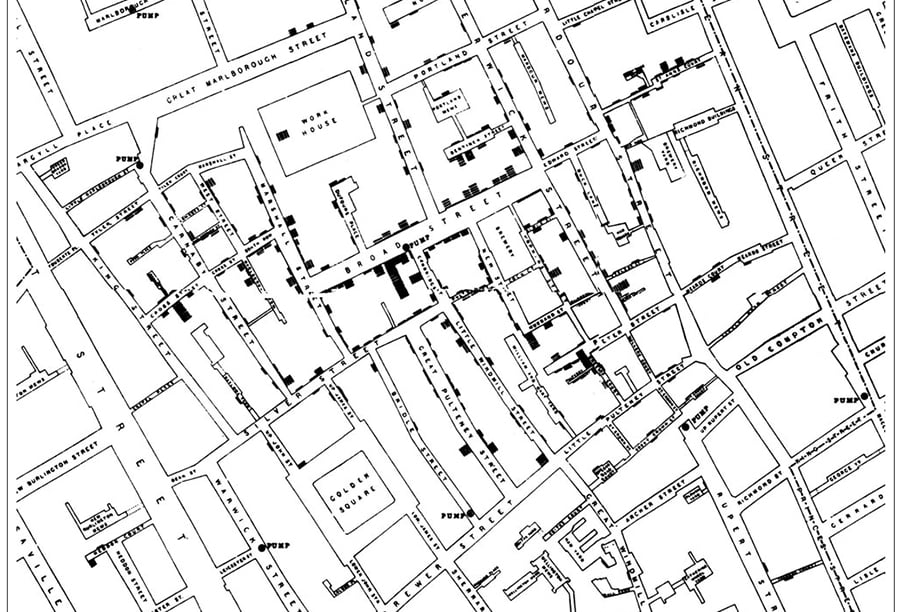
Figure 1: Dr Jon Snow’s original map showing the outbreak of cholera against the location of the water pumps. (click for larger image)
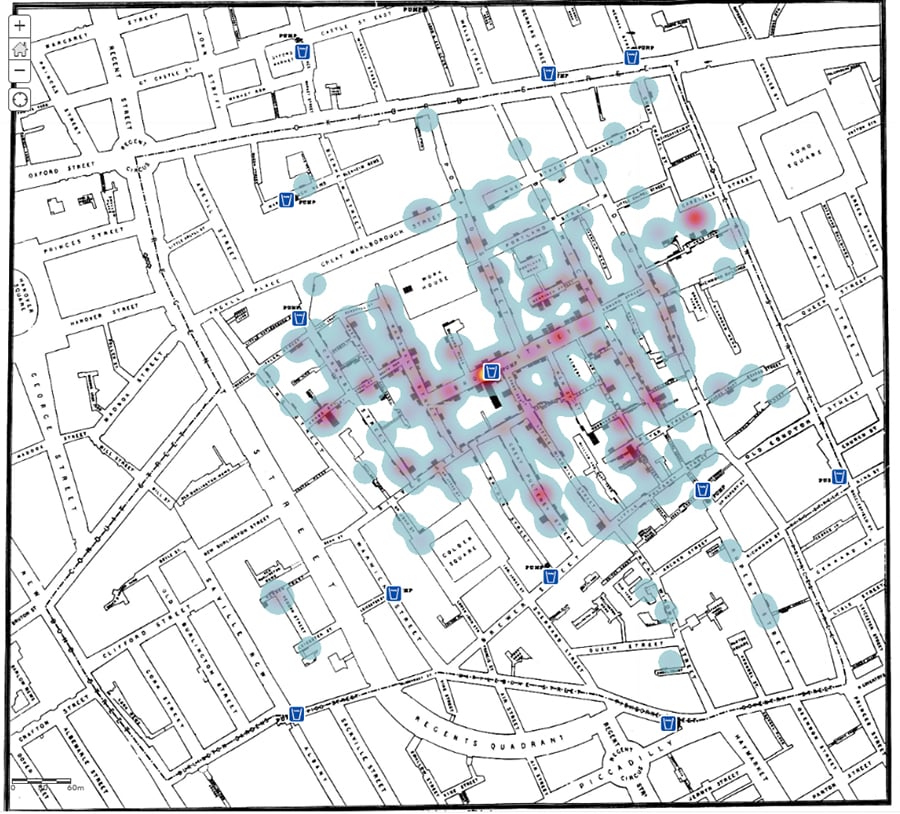
Figure 2: Dr Jon Snow’s original map with heat map analysis showing the outbreak of cholera against the location of the water pumps. (click for larger image)
1854 - 1960
During the next hundred years or so, there was limited development in GIS. Mapping was paper based and there was no computer mapping.
By the 1950s, maps were starting to be used in vehicle routing, development planning and locating points of interest.
1960 - 1975
In the period between 1960 to 1975 three major technological advancements in new computer technology led to the birth of modern GIS. Those were: the ability to output map graphics using line printers; advances in data storage and the processing power of mainframe computers. We now had the ability to record coordinates as data inputs and perform calculations on those coordinates.
Roger Tomlinson, widely acclaimed as the ‘Father of GIS’, during his time with the Canadian Government in the 1960s, was responsible for the creation of the Canadian Geographic Information System (CGIS). CGIS was unique in that it implemented a layering approach to map handling.
The US Census Bureau was also an early adopter of the core principles of GIS. The Bureau began to digitise Census boundaries, roads and urban areas.
The Ordnance Survey GB began to develop their topographic mapping. They used computers to simplify the process of updating future map editions and in 1971, digital mapping was introduced to OS large-scale map production.
1975 - 1990
This era saw the creation of GIS software. Jack Dangermond, co-founder of Esri Inc had studied environmental science, landscape architecture and urban design.
For you
Be part of something bigger, join BCS, The Chartered Institute for IT.
In his own words: “I had some notion of applying computer mapping to my profession”. So, in 1967 he headed off to Harvard where he worked in the Laboratory for Computer Graphics. In the mid-1970s, the Laboratory developed the first vector GIS called ODYSSEY GIS.
By the late 1970s, the progress in computer memory and improved computer graphic capabilities led to the creation of commercial GIS Software. One of the vendors, was Esri, which is now the largest GIS software company in the world, recognised as a world leading expert in GIS, that has played a key role in the history of GIS.
1990 - 2010
The adoption of GIS into the mainstream took off between 1990-2010. This was facilitated by a number of IT advancements: computers were getting cheaper, faster and more powerful; there were an increasing number of GIS software options and digitised mapping data was more readily available. These advancements, together with the launch of new earth observation satellites and the integration of remote sensing technology with GIS, saw more and more applications being developed. GIS found its way into classrooms, to businesses and to governments across the world.
2010 - 2018
Due to the increased adoption of GIS over the previous twenty years, open source GIS was born. GIS data has become more and more ubiquitous, for instance, Landsat satellite imagery is now accessible to all. GIS is now online, in the cloud, and on your mobile.
Today
Today, Geographic Information Systems (GIS) and spatial analysis are being used by everyone whether we realise or not. Have you noticed that location-based search facility in Google? Do you use an app on your phone to get you from A to B? Do you track your parcel delivery or the taxi you booked? All these examples use spatial information to get you the best answer or the most up to date information.
Other examples include:
- Potential store locations - based on customer locations, customer spending power, route-time analysis, competitor locations.
- Predictive crime analysis - using GIS and spatial analysis resulted in 19 per cent reduction in break ins.
- Real time fleet tracking - reducing delivery costs by 10 per cent.
- Europe’s busiest port - 370 vessels per day - helping Dutch infrastructure to rate #1 in the world.
- Air quality - better informed environmental and health policy for Europeans.
Rooted in the science of geography, modern GIS integrates many types of data. It analyses spatial location and organises layers of information into visualisations using maps and 3D scenes. With this unique capability, GIS reveals deeper insights into data, such as patterns, relationships and situations - helping users make smarter decisions.
Hundreds of thousands of organisations in virtually every field are using GIS to make maps that communicate, perform analysis, share information and solve complex problems around the world. This is changing the way the world works.
The Geographic Information System market is predicted to reach US$9billion by 2024* (*Report by Global Market Insights 2024).
Tackling the big data challenge
A number of years ago, the hype was around ‘big data’ and the challenge of how we were going to be able to cope with reams of data. It could be argued that GIS has been dealing with ‘big data’ for years. Satellite imagery, orthophotography, largescale mapping and LIDAR point clouds all create gigabytes of data. These days, combining GIS with geospatial cloud platforms and the improvements in computing power are enabling businesses to analyse massive warehouses of information. The results of this analysis often expose new data patterns and inspires innovative ways to increase success through the understanding of location intelligence.
But, rather than spitting out piles of stats, tables, charts and spreadsheets, the geospatial cloud empowers people to plot complex analysis on easy-to-understand smart maps. These digital maps allow leaders, strategists and many levels of workers to visualise vital trends across lines of business and take decisive action in mission critical projects.
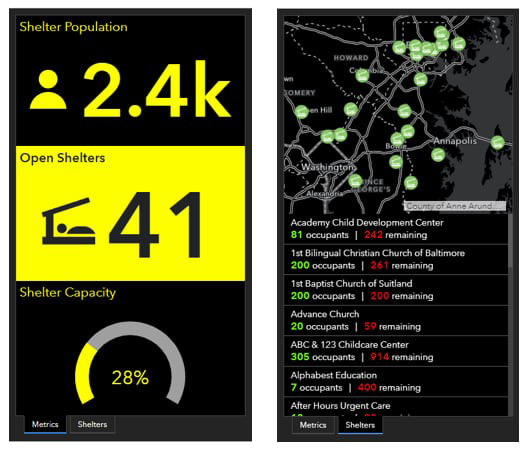
Figure 3: GIS allows local government to make funding and allocation of labour decisions based on real time data. Here are examples of homeless shelters and occupants in the Washington DC area. (click for larger image)
GIS and the maps created for organisations become even more important when linked to the huge data streams from the Internet of Things (IoT), allowing real time monitoring of trends. The location intelligence derived from these streams of information when combined with AI and predictive analytics can map out ways to drive productivity or adjust strategies to keep businesses on track to succeed.
Tracking the movements of life
Modern GIS allows people to create map visualisations that represent thousands of relationships between hundreds of layers of data on demographics, sales, population growth, traits of customers, likely customers, competitors, supply chains, delivery routes and countless other variables. The results can be modelled in 3D to support the work of urban planners and facilities managers, who can also benefit from data streaming from the IoT for real-time updates to their models and maps.
With open platforms to stimulate innovative applications, it’s hard to summarise the richness of the tools and growing power of the geospatial cloud. But, its influence can be seen in the thousands of leading businesses using it to analyse millions of layers of data and produce billions of maps every day.
Geospatial cloud grows in strength, flexibility and accessibility
Increasingly, corporate leaders are realising that intelligent maps provide an effective way to monitor sales, review assets in the field, keep up to date on national and global social and economic trends -reinforcing common goals across all departments.
The flexibility of tools, apps and data available in the geospatial cloud puts its power within reach of everyone in an organisation. Whether employees rely on company servers, desktop computers, laptops, tablets or smartphones, whether they work in the corporate office or are mobile and remote, they can all connect. Such widespread accessibility protects against information silos and allows for wider sharing of knowledge across the organisation.
Utilising instant tools
Drawing upon analytic models, predictive algorithms, apps and big data, detailed insights can emerge through computerised analysis of layers of data on customers’ past buying history along with their demographics by neighbourhood and their interests by age, gender, education or profession. It can also factor in larger trends like local economies, seasonal weather, time of day and national or international political and social trends.
At the broader other end of the scale, smart maps receiving data from sensors on the IoT allow company analysts see trends mapped out in real time. The visualised location intelligence can show buying trends, population shifts or traffic patterns that affect deliveries, supply chains, asset management and research and development, and take into account trends across hundreds of layers of demographic, economic and political data.
Span of influence of the geospatial cloud
Though vital to the for-profit sector, the power of the geospatial cloud is not the sole province of private business and industry.
Widely available free or low-cost spatial data and systems also help most national, state and local governments’ map critical issues from health to crime to utility lines and even to eradicating land mines. And it underpins the work of non-governmental organisations around the world - groups helping to solve environmental issues, address social justice concerns and develop mission-focused, crisis-response strategies for hurricanes, earthquakes or epidemics.
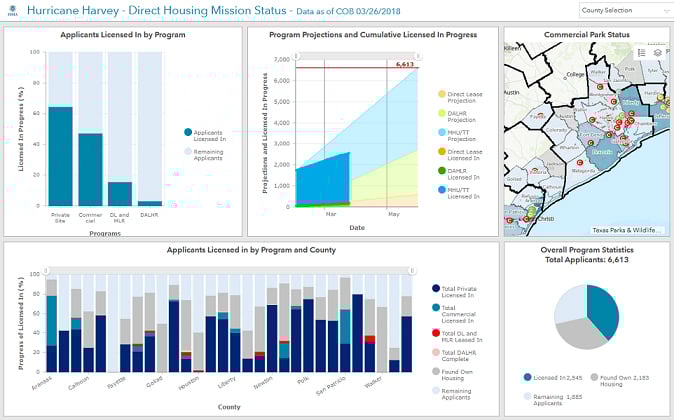
Figure 4: Tourist areas can assess the flow of visitors at key attractions and resources can be applied to areas of greater need. (Click for larger image)
For example, applications can take ongoing satellite imagery and current weather and temperature data to build a Living Atlas - a real-time picture of the world that shows permanent land masses, changing polar caps, epidemics, rising or falling wages and trends in local agriculture or regional social culture.
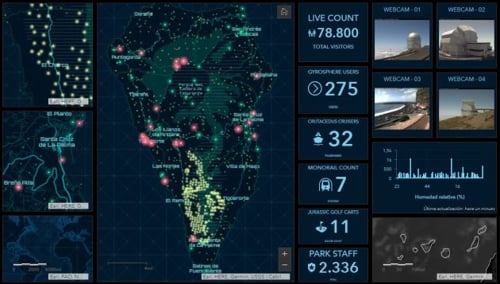
Figure 5: Managing emergencies and acts of God. Here, regional data reflects the dispossessed population and housing need and fulfilment following Hurricane Harvey.
Location-based information can also shape many policy decisions and help people across the political spectrum understand issues and options. The geospatial cloud offers scalable analysis from a single building to a neighbourhood to a town, state, nation, continent, or the entire globe.
GIS keeps evolving and adding depth
Broad in reach and deep in analytic power, the geospatial cloud can engage the minds and spirits of millions around the world through a project like the Esri Living Atlas.
Applications also can be developed that engage people around the world in mission-driven campaigns and social enterprise. Volunteers can work together to track worrisome trends and businesses can use location-based data and predictive apps to understand what consumers will want and need several years from now.
The geospatial cloud introduces a new scale of spatial intelligence and businesses and organisations of every size and purpose are using it to break new ground and digitally transform their enterprises.