Working hours and benefits
Full-time and part-time working
IT specialists in the UK are much less likely to work part-time than other workers and in 2019, just 5% were working part-time hours compared with 24% of workers as a whole.
Female IT specialists were much more likely to be working part-time than males (15% of women in IT positions compared with just 3% of men), but compared to women in other occupations, part-time working amongst women appears extremely low (i.e., 38% amongst women in occupations other than IT).
As with other IT specialists / workers more generally, when asked why they were working part-time, the vast majority (92%) of women working in IT positions (during the 2016-20 period) stated that they were doing so as they did not want a full-time job (compared with 77% of all women in part-time work).
Incidence of part-time working (2020)
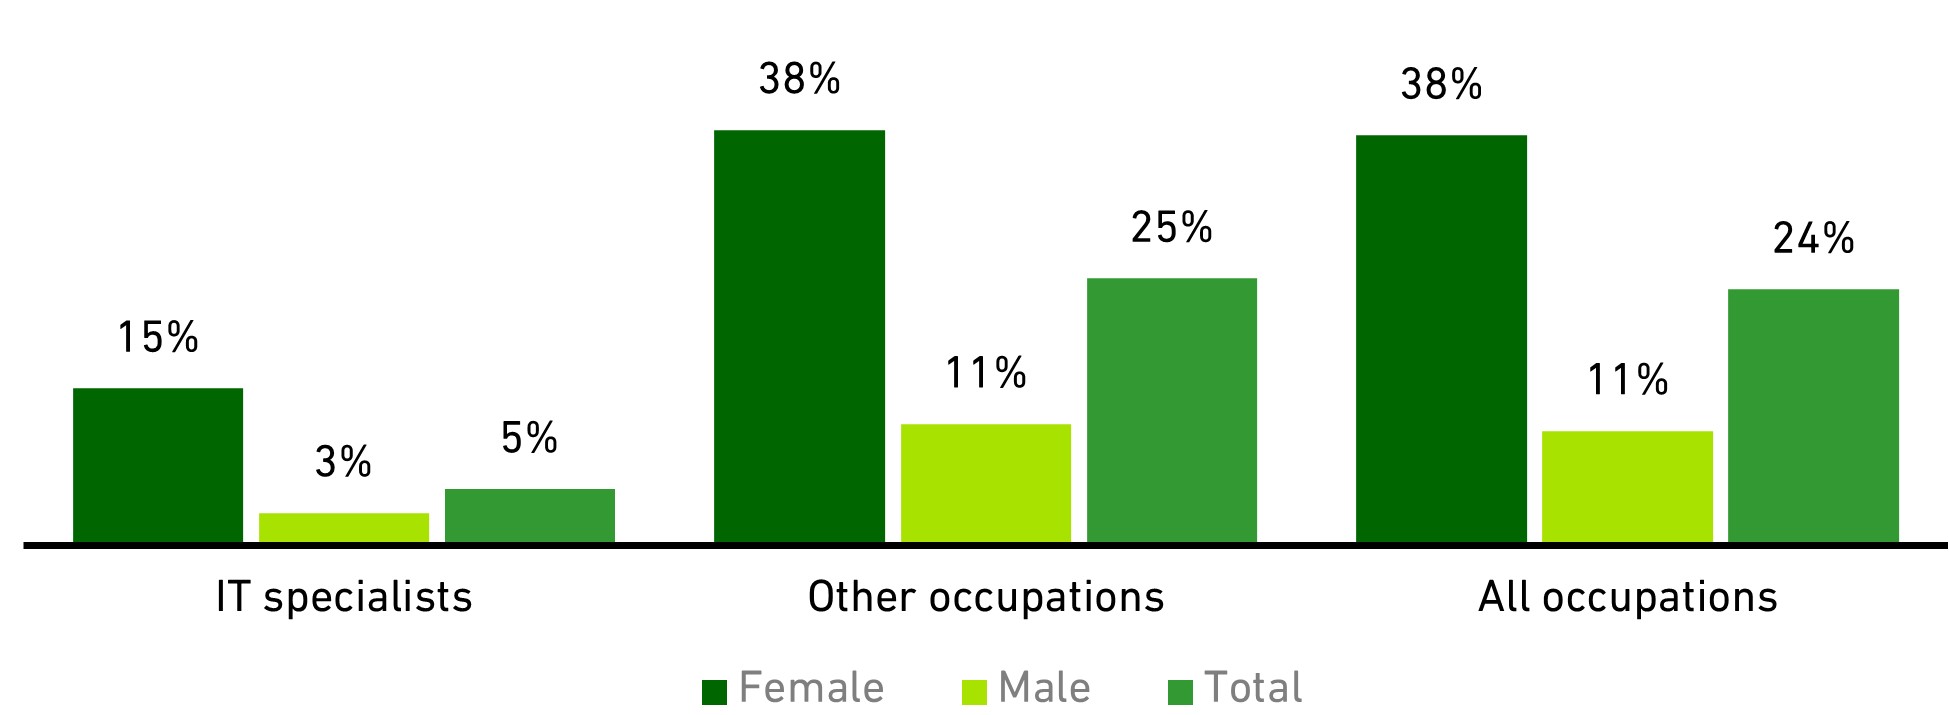
Source: Analysis of ONS Quarterly Labour Force Survey by BCS
Remuneration
The median hourly earnings recorded for female IT specialists working as employees and on a full-time basis in 2020 was £19 per hour - a figure 13% lower than the male equivalent at that time.
However, women working in IT positions do earn substantially more than those employed in other jobs. In 2019, the comparison figure for all female employees in full-time work was 42% lower at just £13 per hour.[3]
Median hourly earnings of full-time employees (2020)
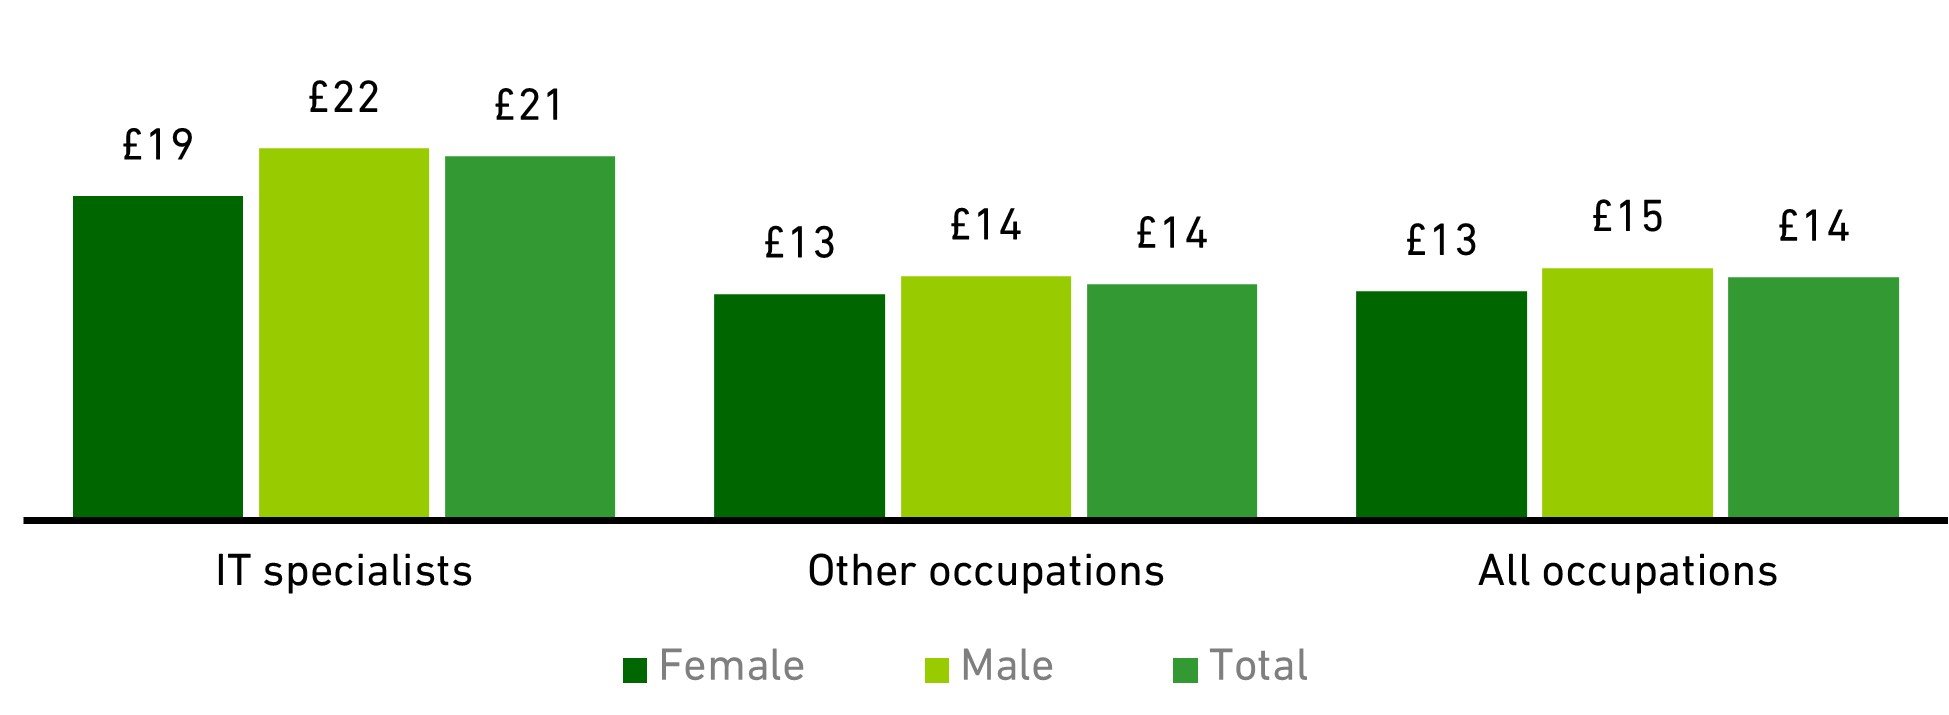
Source: Analysis of ONS Quarterly Labour Force Survey by BCS
Responsibility
Using managerial / supervisory status as a proxy for the likelihood that individuals are given responsibility within their work, it appears that during 2020, female IT specialists (who were employees) were notably less likely than males to be in ‘positions with responsibility’ (comparison figures of 34% and 42% respectively).
By contrast, within the workforce as a whole, the difference was smaller, with 32% of women in ‘responsible positions’ compared with 37% of their male counterparts.
Employees in 'responsible positions' (2020)
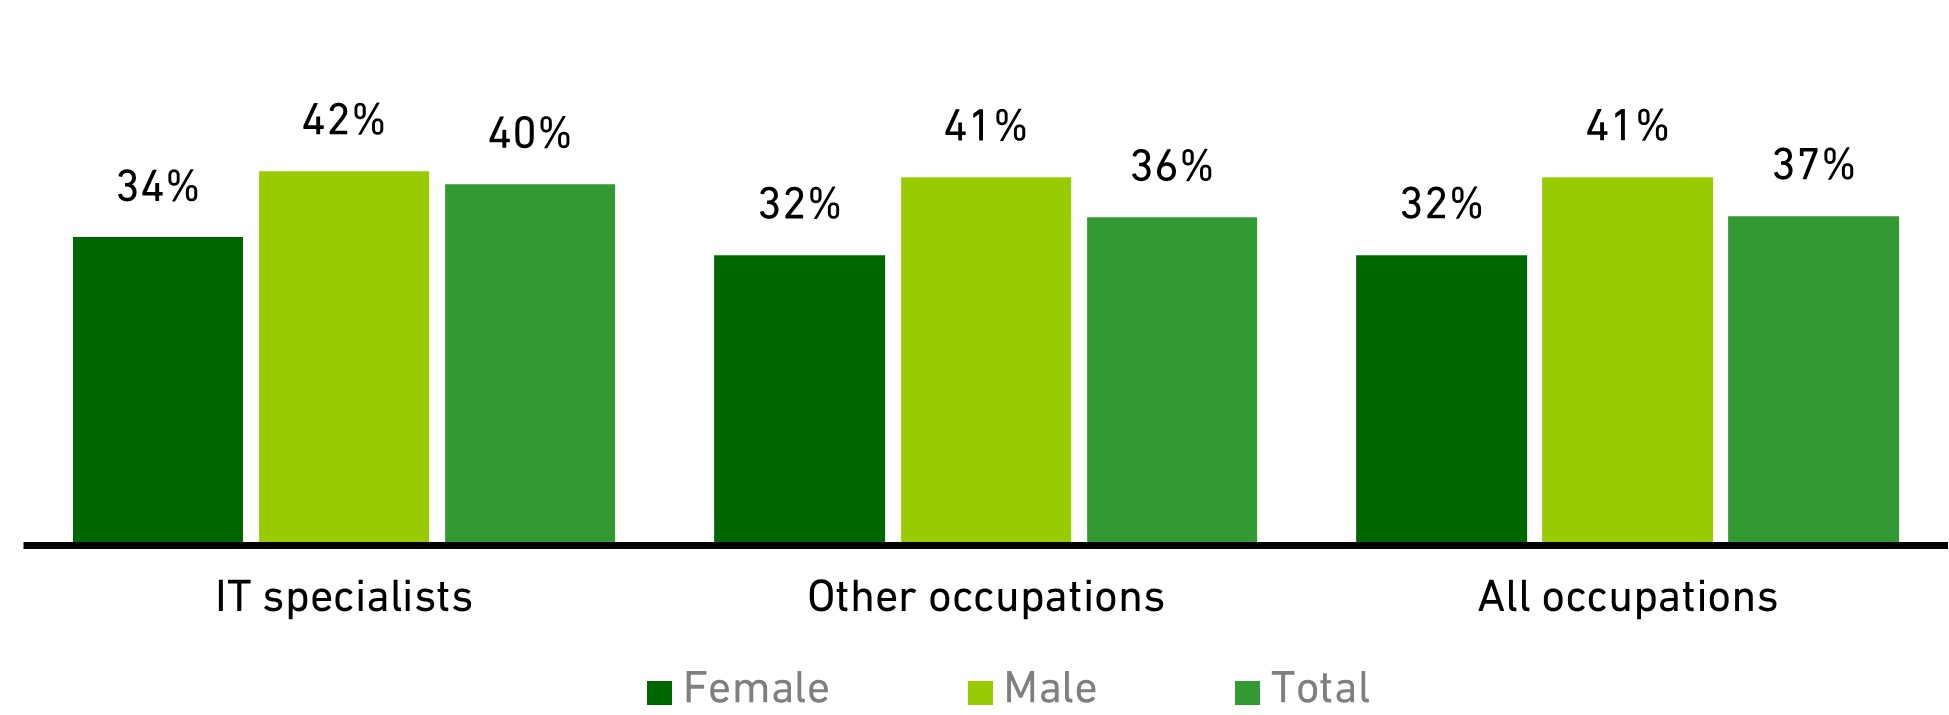
Source: Analysis of ONS Quarterly Labour Force Survey by BCS
[3]All figures given are for full-time permanent employees.