Ethnic minority representation in IT
Some historic notes and background
Below we have set out some scene-setting historical metrics, to demonstrate some of the issues that CBF and BCS think need to be addressed or, at the very least, more closely analysed. This report takes a quantitative approach from the ONS results and a more qualitative and narrative approach later - starting with the broad strokes from this brief historical perspective, moving to the overall UK picture and subsequently focusing on the actual constituency we are discussing - with added personal stories for a fuller flavour.
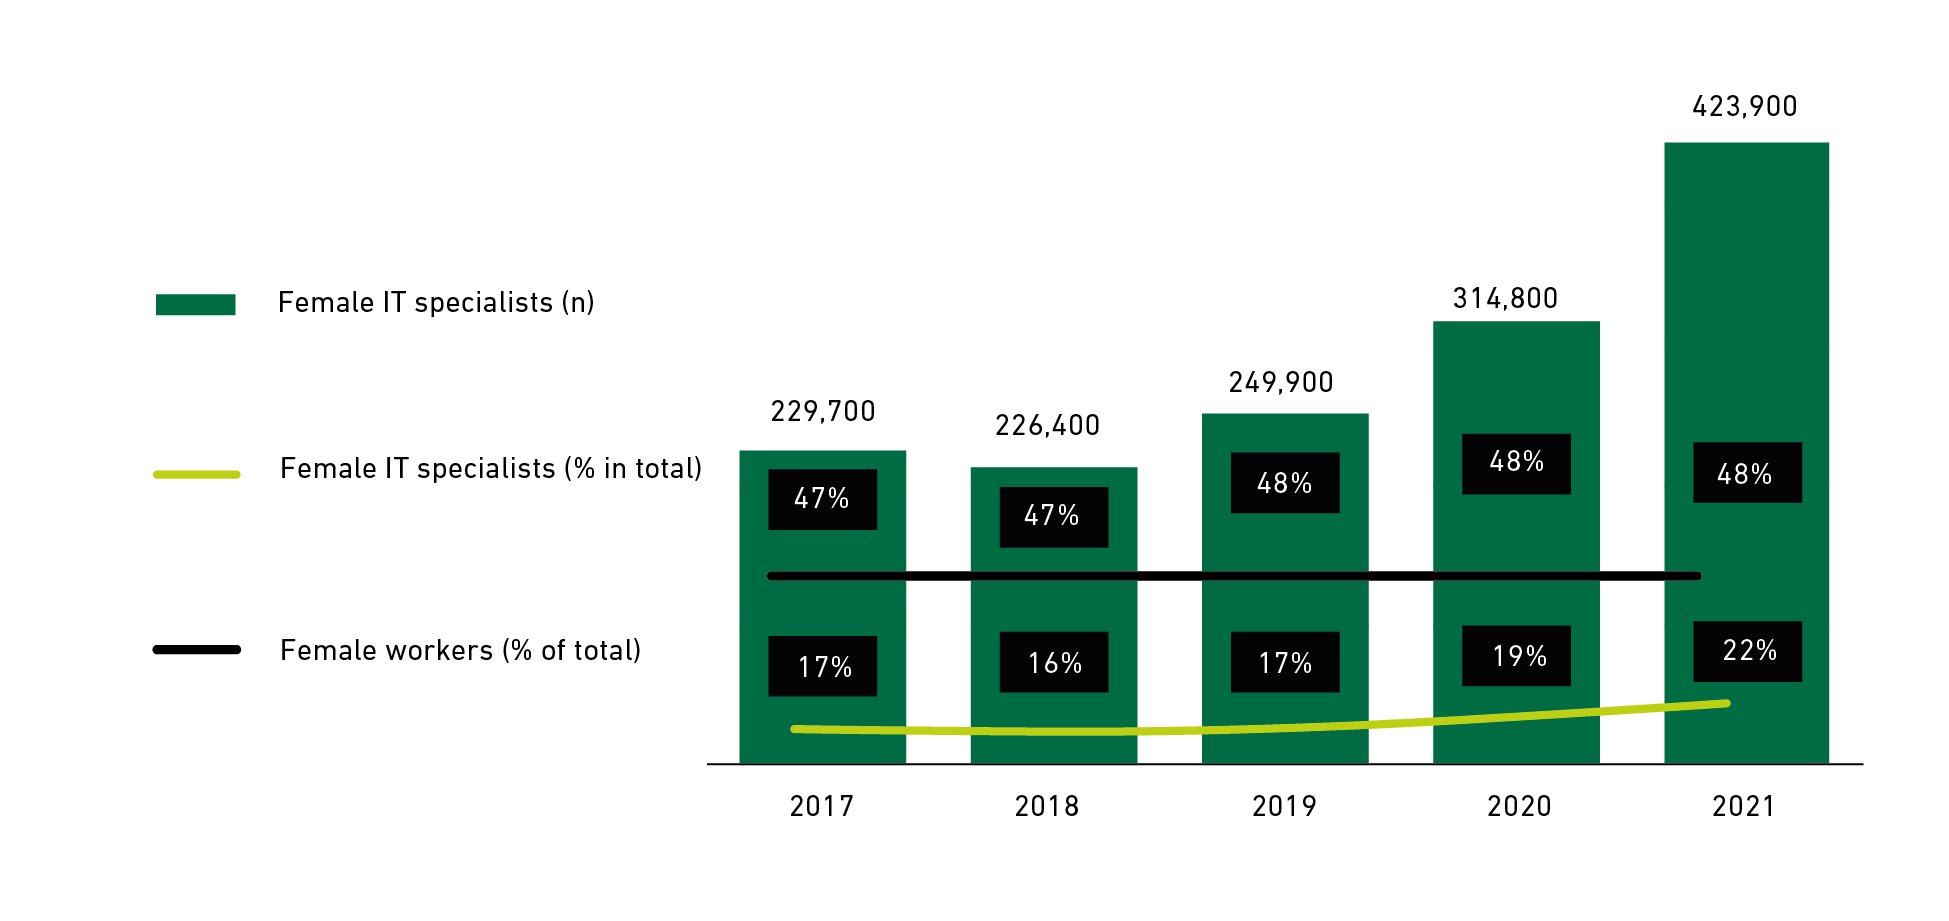
BCS and the BCSWomen Specialist Group have been surveying the under-representation of women in IT for nearly a decade – and reporting on the issue for considerably longer. As the following graph shows, change has been a long time coming – but small progress is now being seen.
Figure 1: Women in UK IT
 Click to expand image
The picture is different, however, for black women. Currently, there are around 12,000 black women in the IT workforce. The number of black women in the IT workforce is two and a half times lower than the number of black women in UK workforce as a whole. At a time when the concerns over data bias and the value of creating widely usable products through diverse teams are well-known, this is a situation that requires attention.
If we translate to real-world numbers, for black women to be truly represented there is a shortfall of at least 20,000 black women. Indeed, if overall gender representation in IT were equal to the workforce ‘norm’ there would have been an additional 486,000 IT specialists in the UK.
A look back at previous BCS reports shows the scale of the problem faced generally by workers from ethnic minority groups – and also some progress points. We will take three examples to illustrate this.
The graph below shows those from ethnic minorities – male and female - in leadership roles.
Figure 2: Likelihood to be in a position of authority
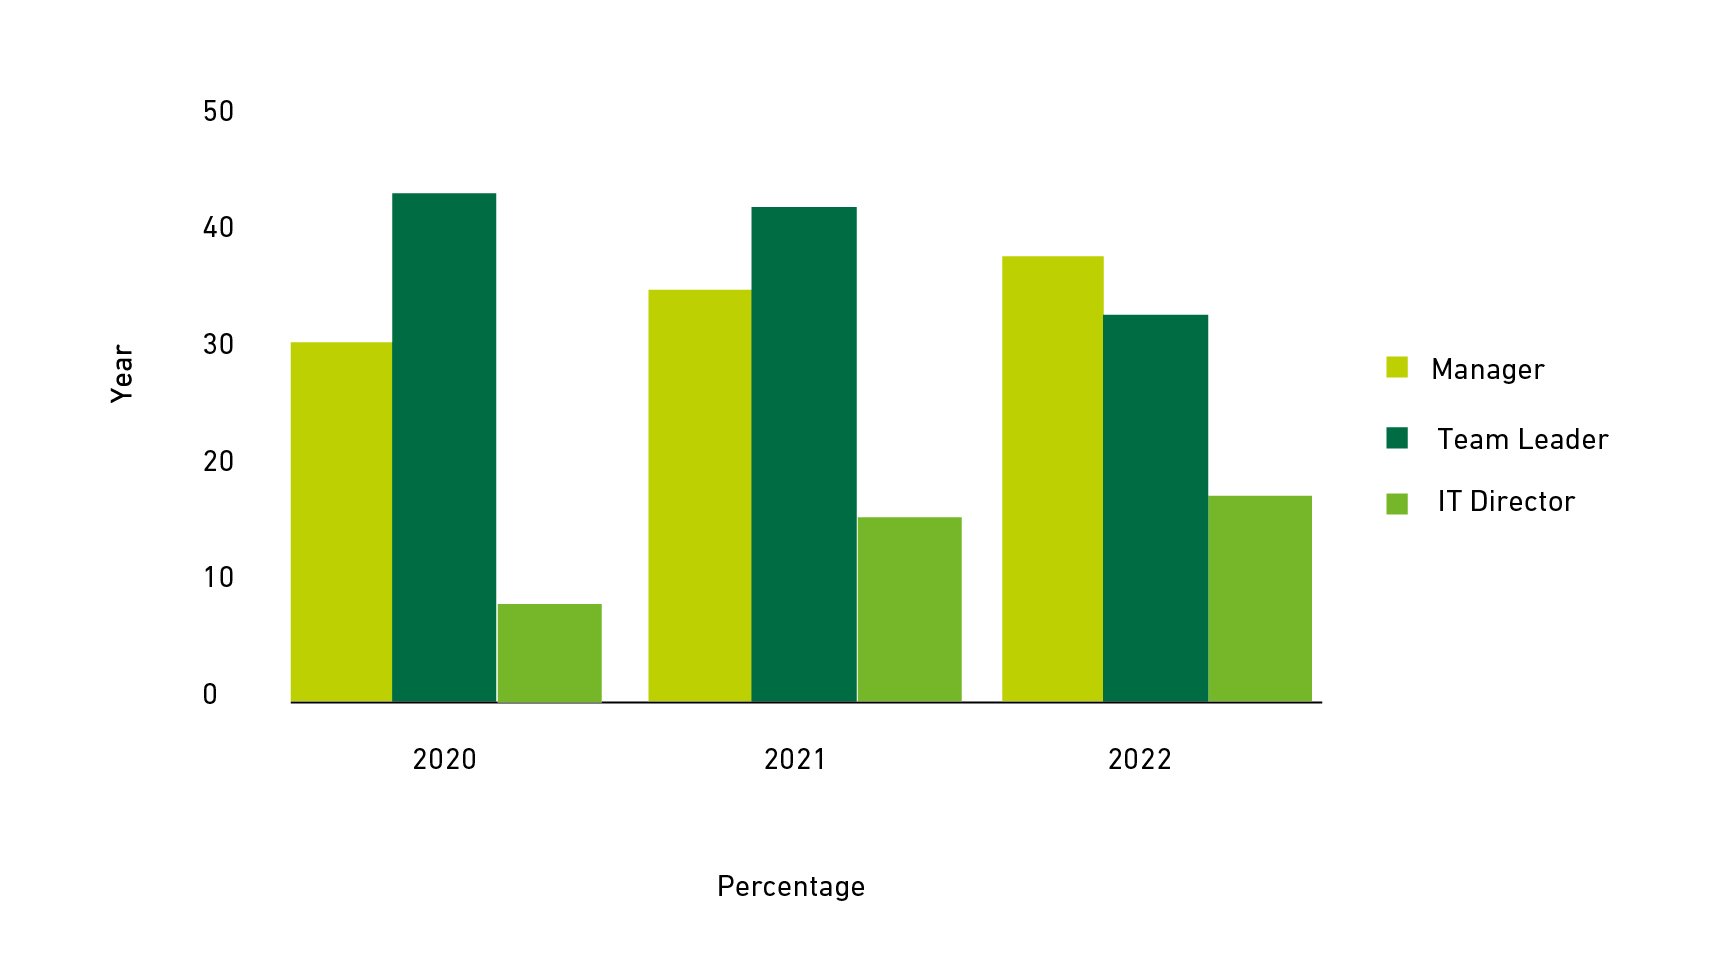
Leadership
Likelihood to be in a position of responsibility, measured by use of terms ‘manager’, ‘team leader’, ‘director’, source BCS analysis of ONS figures.
Representation at board level has clearly improved over the past three years. Behind the scenes, however, the non-director numbers are generally static, which could mean that the gains for ethnic minorities at director level may not be maintained or that, at present, the pipeline getting ethnic minorities into management roles is running ahead of expected numbers. Either way it is important to note that for ethnic minority people the chances of a responsible position are higher in IT than the workplace overall. So that is progress.
Higher education and degree attainment
A consistent theme that comes out in the CBF/BCS part of this report is that black females need to out-perform their counterparts to get noticed, make progress, or even land a job in the first place. It is therefore interesting to note that ethnic minorities, in general terms are more likely to have a degree.
That overall number has been very clear for the three years BCS has been analysing ONS figures, as the chart below shows. An interesting comparator is the number for those of Indian background, whose representation in the IT workforce runs at between 8% and 9% against a general workforce representation of only 3%.
Figure 3: Degree attainment
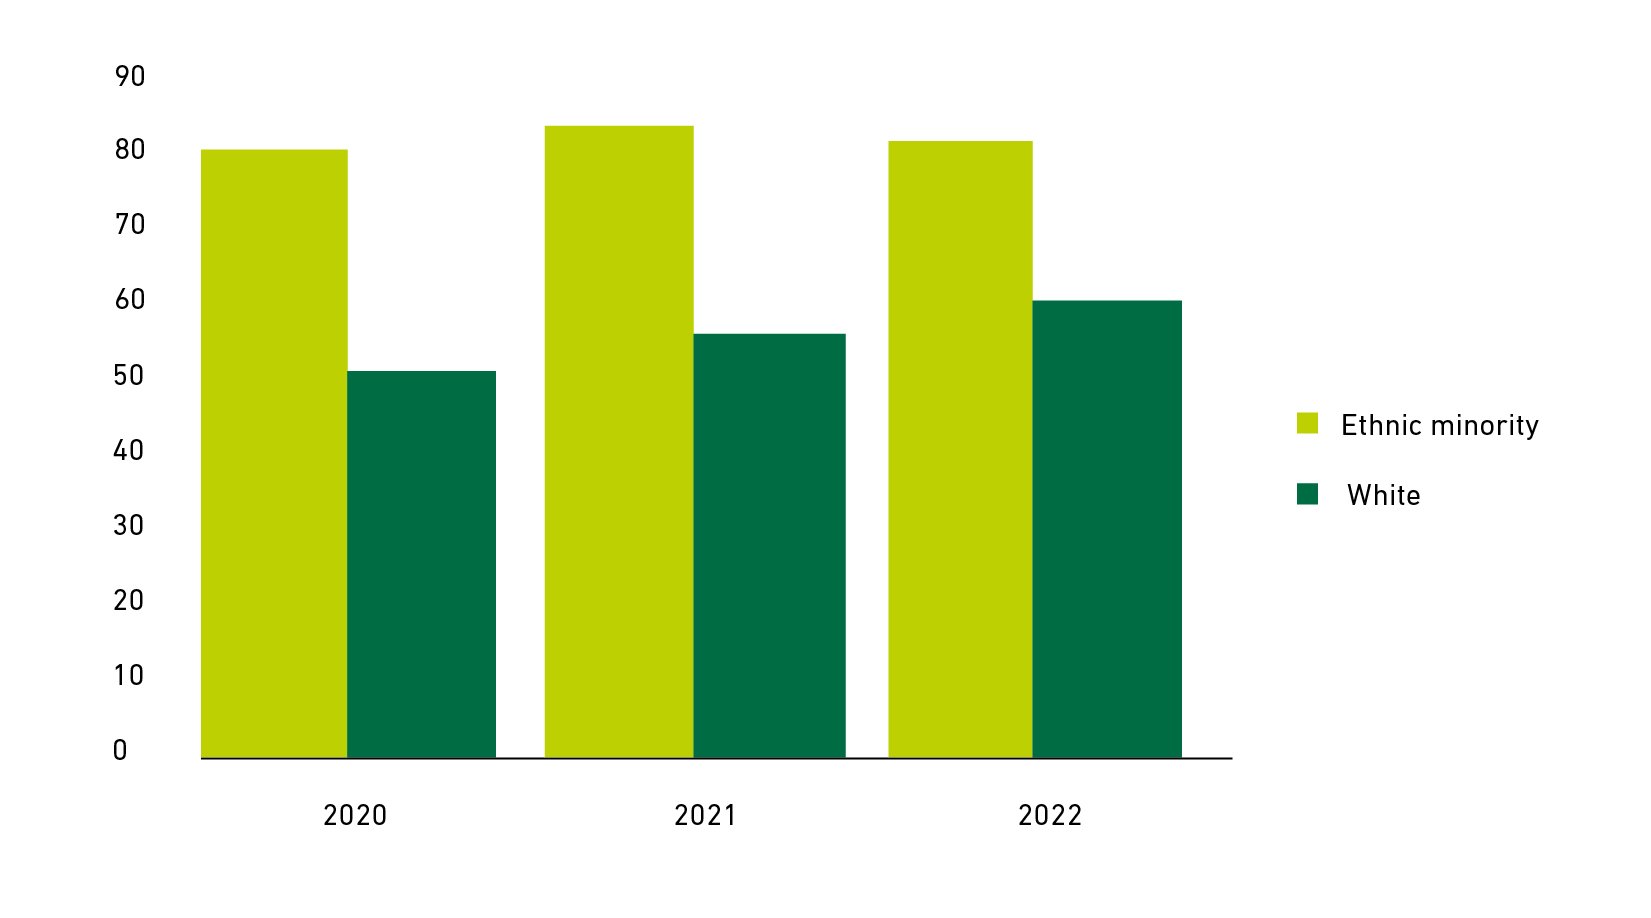
Degree attainment by ethnicity (all genders): source BCS analysis of ONS figures
There are two important caveats to these high-level numbers. Firstly, the degree level is not taken into account here. So although the raw numbers are higher, when the focus is narrowed to good degrees (defined as a first or 2:1) the figures are much worse for ethnic minority students. The Office for Students go into this in detail (search: Degree attainment: Black, Asian and minority ethnic students).
Secondly, and interestingly from an IT perspective, this changes again if we focus on those with IT-related degrees, where people from ethnic minorities are again ahead of the curve. See the Skills section for more details.
Splitting ethnicities shows that the general situation can be improved. In 2020 and 2021, according to the ONS, Black / African / Caribbean / Black British people had a 2% representation in the IT industry against 3% in the workforce as a whole. This improved to parity in 2022, but, whilst this is another positive, it is weighted toward black men.
An interesting comparator is the number for those of Indian background, whose representation in the IT workforce runs at between 8% and 9% against a general workforce representation of only 3%.
Unemployment
Relative unemployment numbers are another cause for concern. The approximately 10,000 unemployed IT specialists from ethnic minority groups in the UK accounted for 40% of all unemployed IT specialists at that time. At 2.8% the associated unemployment rate for IT specialists from ethnic minority groups was notably higher than that of their white counterparts (1.6%) though well below the overall unemployment rate for the ethnic minority workforce of the UK (8.2%).
A note on terminology
As per the ONS guidelines we use ‘ethnic minorities’ to refer to all ethnic groups except the White British group. Where this is split further the approach is noted – for example the section ‘Ethnicity in IT explored’.
ONS
Black / African / Caribbean / Black British people had a...
2% representation in the industry