


Working hours and benefits
Full-time and part-time working
IT specialists in the UK are much less likely to work part-time than other workers and in 2020, just 5% were working part-time hours compared with 24% of workers as a whole.
Disabled IT specialists were more likely be working in part-time positions (8%) than others in IT jobs, though again, the incidence of part-time working for those working in IT is less than one quarter of that recorded amongst disabled workers more generally (38% of whom worked part-time during 2020).
Whilst the relative incidence of part-time working is low for disabled IT specialists and IT specialists as a whole, it would appear that, for the majority at least, this is out of choice - albeit a slightly less common choice for those with disabilities (68% of whom stated that they worked part-time as they did not want a full-time job over the 2016-20 period, compared with 82% of IT specialists as a whole).
Incidence of part-time working (2020)
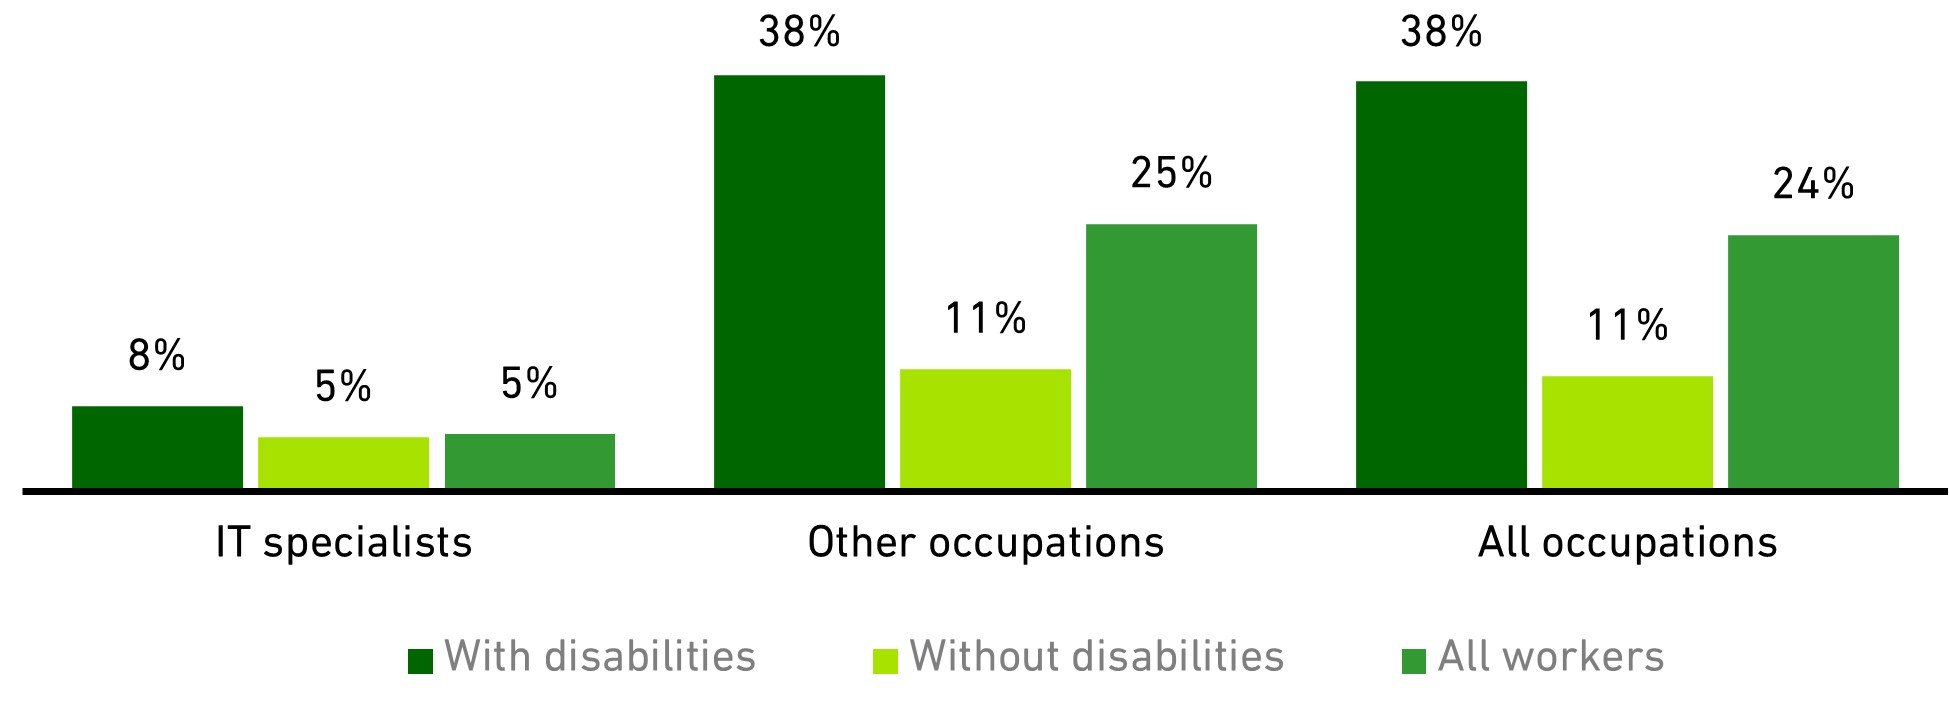
Source: Analysis of ONS Quarterly Labour Force Survey by BCS
Remuneration
In 2020, the gross hourly pay for IT specialists with disabilities was £19phr - 88% of the remuneration for IT specialists without disabilities (£21phr). However, pay for IT specialists with disabilities was 56% higher than that of other workers with disabilities (£12phr).[3]
Median hourly earnings of full-time employees (2020)
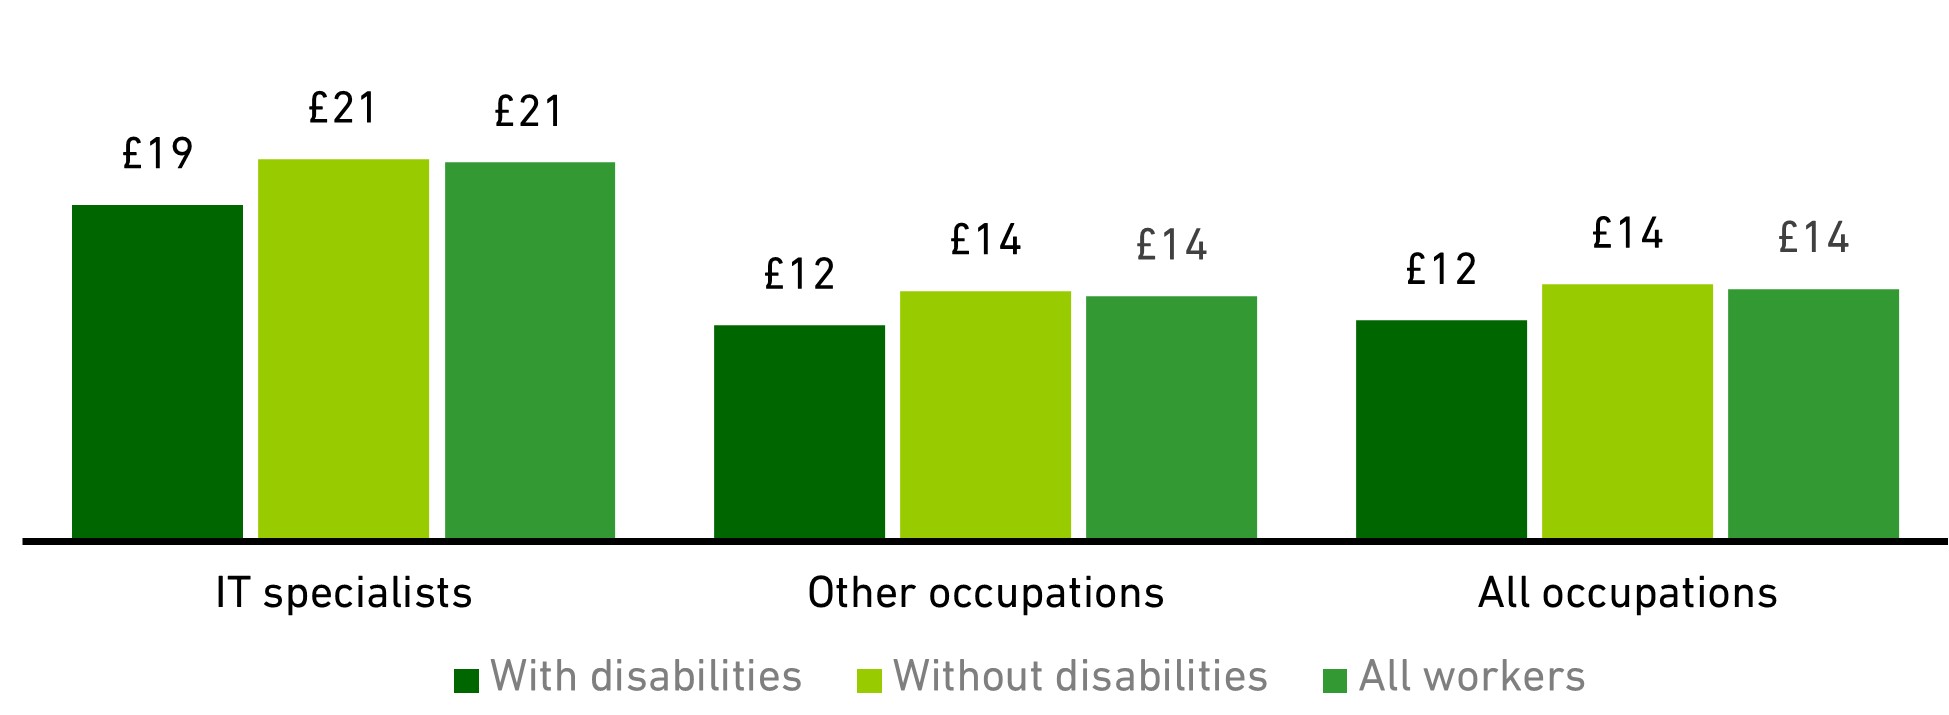
Source: Analysis of ONS Quarterly Labour Force Survey by BCS
Responsibility
Using managerial / supervisory status as a proxy for the likelihood that individuals are given responsibility within their work, it would appear that during 2020, IT specialists with disabilities (employees) were less likely to hold positions of responsibility than those without disabilities (i.e. 35% stating that they were a manager / foreman / team leader compared with 41% of IT specialists without disabilities).
In both cases, the likelihood of individuals holding positions of responsibility was higher than others in the workforce as a whole, amongst which, just 30% of workers with disabilities and 38% of those without stated that they were a manager / foreman / team leader.
Employees in 'responsible positions' (2020)
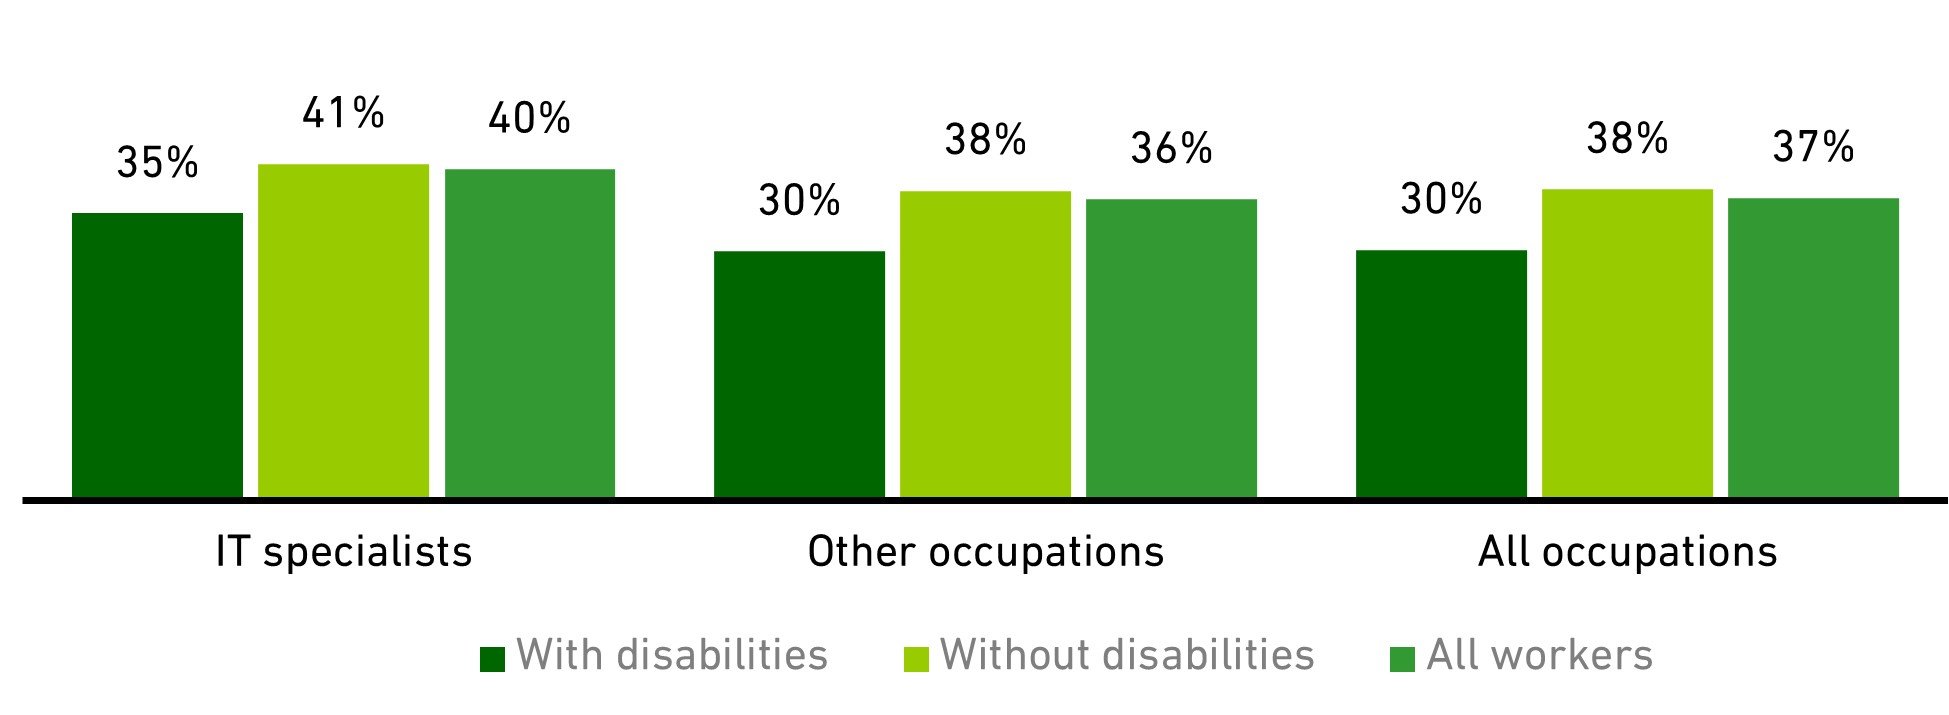
Source: Analysis of ONS Quarterly Labour Force Survey by BCS
[3]All figures given are for full-time permanent employees.