


Employment characteristics
Self-employment
The incidence of self-employment has fallen over the past two years – particularly amongst IT specialists where a fall of five percentage points has occurred over the 2019-22 period (from 11% to 6%). By 2022 it is estimated that there were approximately 122,000 IT specialists working on a self-employed basis in the UK.
For both IT specialists and other workers, the incidence of self-employment was found to be higher amongst individuals that were from older age groups - the difference being four percentage points amongst IT specialists and five percentage points for all workers.
Age and the incidence of self-employment (2022)
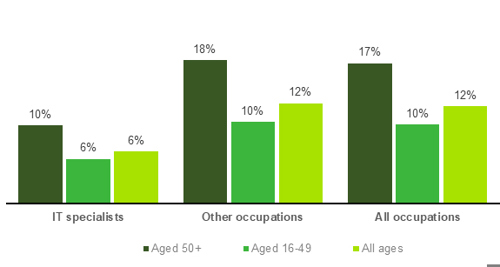
Source: Analysis of ONS Quarterly Labour Force Survey by BCS
Employees and size of workplace
IT specialists working as employees are, perhaps understandably, more likely than others to be employed within larger workplaces (i.e. as micro/small sites are less likely to have an in-house function) and whilst 30% of UK employees as a whole were working in larger sites during 2022 (those with 250 or more staff), a figure of 42% was recorded for IT specialist employees.
This observation was also true for older IT specialists in 2022 – again 42% of which were working in larger workplaces during 2022.
Age and size of workplace (2022)
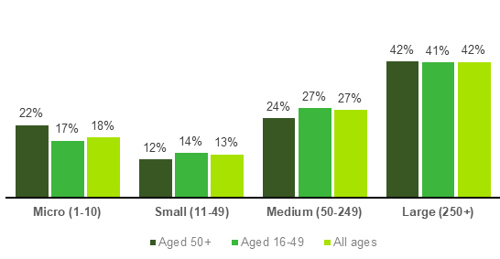
Source: Analysis of ONS Quarterly Labour Force Survey by BCS
As illustrated in the chart above, IT specialists aged 50+ were much more likely than others to be working in micro business sites with comparison figure in this case of 22% and 17% respectively during 2022 (for employees aged 50+/under 50).
Industry of employment
Over four in ten IT specialists (45%) over 50 years of age were working in IT businesses in 2022 as were those aged 16-49 (46%). After IT, the next largest employment sector for IT specialists aged 50+ in 2022 was Banking/Finance (20%) followed by the Public sector (14%) and this was also true for IT specialists as a whole.
Looking in more detail at the levels of representation for older IT specialists in different industries, it can be seen that representation was highest in Construction (26%) and transport/communications (25%) and lowest amongst Energy/Water and Distribution/ hotels/ restaurants businesses (18% and 19% respectively).
Age by occupation and industry (2022)
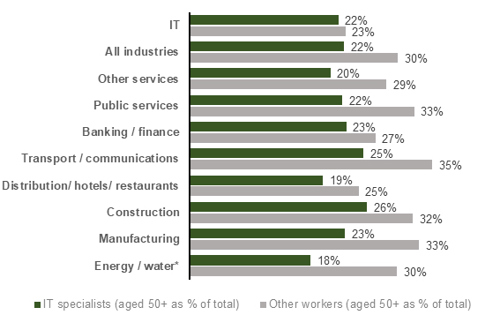
Source: Analysis of ONS Quarterly Labour Force Survey by BCS
* Five-year average
[2] The LFS asks individuals about the number of employees at their workplace as opposed to enterprise / organisation as a whole.