


Working hours and benefits
Full-time and part-time working
IT specialists in the UK are much less likely to work part-time than other workers, and in 2022, just 5% were working part-time hours compared with 23% of workers as a whole. Older IT specialists were more likely to be working part-time – 8% of those aged 50 and above stating this to be the case.
As with other IT specialists/workers more generally, when asked why they were working part-time, the majority of older IT specialists working part-time stated that they were working reduced hours as they did not want a full-time job (85% as a whole and 93% of those aged 50+ stating this to be the case on average over the 2018-22 period).
Incidence of part-time working (2022)
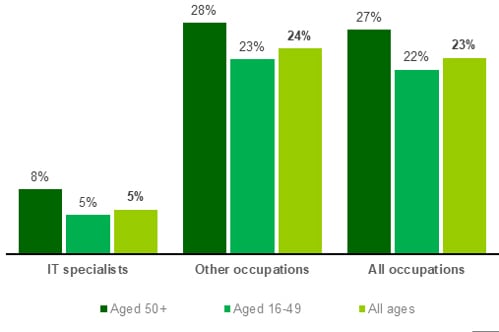
Source: Analysis of ONS Quarterly Labour Force Survey by BCS
Remuneration
In 2022, the median hourly earnings recorded for older IT specialists working as employees and on a full-time basis was £26 per hour – an amount 8% higher than that recorded for IT specialists as a whole (£24 per hour) and 63% greater than that for all older employees in the UK at that time (for which a comparison figure of £15 per hour was recorded)[3]
Median hourly earnings of full-time employees (2022)
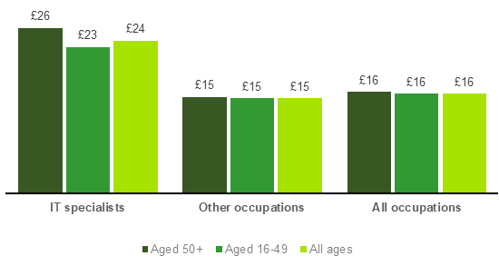
Source: Analysis of ONS Quarterly Labour Force Survey by BCS
Responsibility
Using Managerial/supervisory status as a proxy for the likelihood that individuals are given responsibility within their work, it is clear that during 2022, older IT specialists (that were employees) were much more likely to be in ‘positions of responsibility’ than individuals of other ages working in IT roles (comparison figures of 48% and 41% respectively).
This was also the case within the wider workforce, though in this case the difference was less pronounced (five percentage points).
Employees in 'responsible positions' (2022)
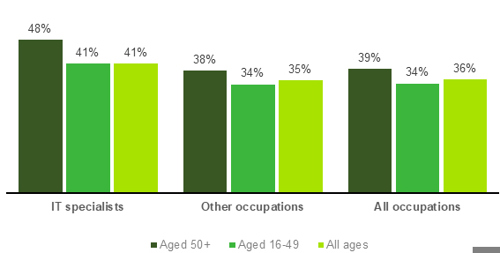
Source: Analysis of ONS Quarterly Labour Force Survey by BCS
[3]All figures given are for full-time permanent employees.