For a number of years now, starting back with the BCSWomen Group, BCS has been tracking and reporting on levels of female representation within the IT labour market. The idea was to highlight areas of concern for the industry and to provide supporting evidence for those seeking to improve the gender balance within IT.
In 2017, we expanded the reach of our analysis to cover other aspects of the nine protected characteristics of the Equality Act 2010. The commentary now includes figures on people with disabilities, ethnic minorities and older workers.
The insights contained within this article are drawn from four reports where we have analysed secondary data from the ONS Labour Force Survey. These reports aim to inform BCS policy as we provide a definitive source of information concerning the levels of ‘minority’ representation amongst the IT professions.
We also want to identify and explore the extent to which the market is failing those from minority groups, as demonstrated by below-average levels of representation and compensation amongst these groups, but to also celebrate where IT performs well.
Gender
In raw numbers, there were 312,000 female IT specialists in the UK workforce during 2020. This represented 19% of the total at that time, a low figure, but one that also shows improvement. The level of female representation in IT has increased over the past five years: in 2018, the figure was at 226,000. We could represent this as a 38% increase - very good - although the wider picture is still that female representation remains well below the level observed within the workforce as a whole (48%).
There are localised bright spots - in Scotland, this figure runs to 23%. And certain disciplines have better female participation. In web design and development there is 35% female participation, and IT project and programme managers are 26% female.
This varies across industry too. Public services, for example, have 32% female IT workforces, but that is against 71% female employment across other occupations in the same sector.
A higher proportion of female IT specialists are employed in large organisations (250+) compared with males (50% versus 41%). The female earning figures are still below their male counterparts, although they are ahead of the ‘all occupations’ figure for male and female. Another positive is in the area of responsibility: this is better for female IT specialists: 34% are in responsible positions, compared to 32% across professions in general.
And as a comment on potential, females are more likely to be qualified to degree level - 67% versus 61% in men and that gap has increased since 2019.
Ethnicity
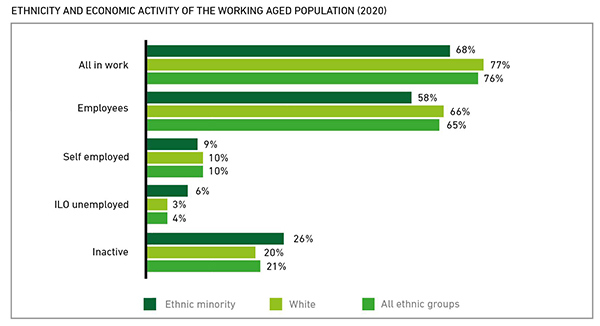
The figures have always looked slightly better in IT professions with an ethnicity lens - although within individual ethnicities, the picture becomes much more complex. As a headline positive, at 18%, ethnic minority representation was higher amongst IT specialists than within the UK workforce as a whole, which was 12% in 2020. In total, there were 300,000 ethnic minority IT specialists in the UK, an increase on the 2018 number, which was 266,000, but down a percentage point.
Ethnic minorities are better represented in London (32%) and in the area of business analysis (26%). However, in 2019, the London figure ran to 35%. For a comparison example in disciplines, in business analysis, representation of ethnic minorities has grown from 23% to 26%, overtaking project and programme managers as the leading discipline from 2019.
On the other end of the scale, in Northern Ireland only 4% of the IT workforce are from ethnic minorities, with specialist IT managers from the whole of the UK running at 12% - although for context, 12% is the current representation of all ethnic minorities in the UK workforce as a whole.
We can see potential reflected by qualification level because almost nine in ten ethnic minority IT specialists have an HE level qualification (87%) compared with less than seven in ten (67%) of those from white ethnic groups.
Digging into specific ethnicities is trickier. However, some trends do emerge. Professionals with Indian heritage are very well represented in 2020 - with their representation as IT specialists running at 9% against 3% in other occupations - this figure holds from 2019.
However, those from Black/African/Caribbean/Black British backgrounds have dropped - 2% representation in IT specialism against 3% in other occupations. In 2019, there was parity in these figures.
Disability
The outlook for those with disabilities is consistently less good. The background is that people with visible and invisible differences already start at a disadvantage: though accounting for 20% of the working age population in 2020, people with disabilities constituted only 14% of the total UK workforce.
There were 158,000 IT specialists in the UK with disabilities in 2020 - 10% of all IT specialists in the UK at that time, although this is slightly up from 2019’s 128,000 (9%).
A small ray of light in terms of attitude is reflected in the finding that IT specialists with disabilities are more likely to receive job-related education/training, with 30% stating they had received some in the previous 13 weeks during 2020 (compared with 23% of those without disabilities). This is also up from 2019 at 28%.
Age
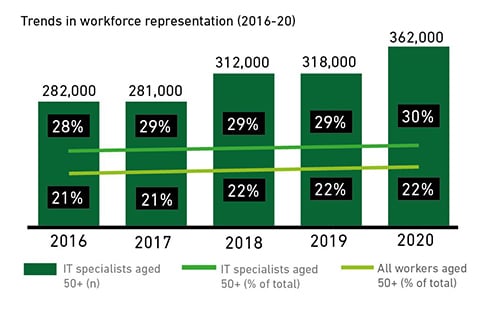
The background for age is that people aged 50 and above accounted for 31% of the working age population in 2020 and 30% of those in work.
In the potential category, if representation in IT was equal to the workforce 'norm' there would have been an additional 119,000 IT specialists in the UK aged 50 or above, or 480,000 in total. The potential in 2019 was 95,000, so the picture for older professionals is getting worse, although the potential pool of experience has commensurately increased for organisations.
In 2020, there were estimated to be around 13,000 unemployed IT specialists in the UK aged 50 and over, which equates to an unemployment rate of 3.4% - well above the rate for IT specialists aged 16-49 (2.2%). In 2019, this was 8,000, so again a significant worsening.
Unsurprisingly, older IT specialists (aged over 50) are notably more likely to hold ‘responsible positions’ - almost half (47%) having managerial/supervisory status in their job (compared with 38% of younger IT specialists, those aged below 50). But, again, this is down from 2019’s 52%.
In the broader UK picture, a related upward trend is in qualification level: younger IT specialists are much more likely to hold an IT degree than those aged 50 and above (14% versus 8% during 2020).
Where next?
There are still plenty of areas to be explored in how we get everyone genuinely involved in the information society. Our four reports don’t really touch on neurodiversity issues; there are other protected characteristics in the Equality Act and there will undoubtedly be positive and negative changes post-COVID with, amongst other things, more normalised remote working. BCS will continue picking these subjects up.
Terminology evolves too - for example, you will note we have dropped the term BAME from the reports this year. Whilst nuance is important, if difficult to achieve, BCS is committed to being as inclusive as possible, which is why we like to hear from members about their personal experiences.
The full reports are available at via https://mybcs.bcs.org/