Kay Hardy, Senior Software Consultant at Capita Software and Deborah Garfen, Digital Product Designer at the British Heart Foundation, share their experience of working collaboratively with a variety of tools from Miro to Microsoft.

COVID-19 has forced a monumental change in working. Before, around 5% of the UK’s 33m workforce worked from home, now it’s 47%. In fact, Twitter recently announced that when normality resumes, its workers can continue to work in this way. So, what are the tools that are making this possible and how do we make them work for us?

Miro and how we’re using it

Miro is an online, collaborative platform that enables remote working in real-time. It comes with a huge selection of pre-made templates and colourful sticky notes that can help you facilitate productive and engaging workshops. Miro can be viewed without logging in and can be exported as an image or PDF.

The British Heart Foundation uses Miro to support the development of digital products. We begin workshops by sharing our screen in a Microsoft Teams call, explaining the exercise and answering any questions. Workshops normally require two facilitators: one to guide the exercise and the other to type-up the team’s input in Miro. We then work our way around the board by zooming in on each section.

Competitor analysis

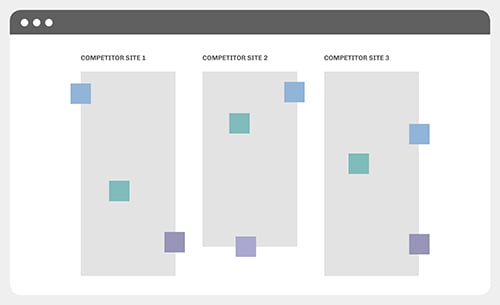
To analyse the digital products of competitors collaboratively, we start by downloading screenshots of site pages using Google Chrome’s Full Page Screen Capture and dropping these images into Miro. We use ‘connection line’ arrows to demonstrate user journeys and add comments using colour-coordinated sticky notes. We then create a ‘findings and recommendations’ report in Microsoft Word to share with our stakeholders, alongside the Miro board. We have found that sharing visuals gives context to our recommendations and supports us in explaining our decision-making.

Competitor analysis diagram

Fig 1. Competitor analysis diagram. Click the image to enlarge.

Empathy mapping

We use Miro to facilitate empathy mapping workshops. This is where we capture a product team’s combined user knowledge and map-out user attitudes, behaviours, needs and pain points. Miro has a selection of empathy mapping templates available. However, we made a map from scratch to include additional questions around the framework below. You can copy and paste the map.

  1. WHO are we empathising with?
  2. What do they need to DO?
  3. What do they SEE?
  4. What do they SAY?
  5. What do they actually DO?
  6. What do they HEAR?
  7. What do they THINK and FEEL?

After the workshops, the facilitators work together to group the sticky notes into categories, identifying patterns in user attitudes and behaviours. The result is shared with the product team and any additional ideas are gathered.

‘Miro provided a great visual! It gave a face-to-face interactive feel to the workshop, even though it was delivered remotely. We could really see the product starting to take shape through the eyes of our personas.’ - Health Services Engagement team, British Heart Foundation

Empathy mapping diagram

Fig 2. Empathy mapping diagram (download template). Click the image to enlarge.

Journey mapping

We adapted one of Miro’s pre-made journey mapping templates to identify the stages of the end-to-end user experience. One facilitator guides the session and the other uses sticky notes to map ideas that could support our audience at each stage. Following the session, the facilitators review the ideas and input them to FunRetro to narrow them down, based on anticipated value to the user.

Journey mapping diagram

Fig 3. Journey mapping diagram (download template). Click the image to enlarge.

FunRetro and how we’re using it

Ideation exercise FunRetro is an online tool, that is most commonly used to review sprint sessions. The British Heart Foundation also uses it to facilitate collaborative ideation exercises. We opted for FunRetro because it is easy to use and participants do not require a login to vote and add comments via a shared link. Additionally, you can set the maximum number of times someone can vote and hide the vote count to avoid bias.

Fun retro diagram

Fig 4. FunRetro diagram. Click the image to enlarge.

We take the ideas generated in our Miro journey mapping workshop and categorise them by quick wins, ideas that are achievable within three months from now and a year from now. We then share a link to the board via Microsoft Teams, explain how voting works and encourage the team to elaborate on the ideas using the comments feature. We then ask them to vote for their top-three favourite ideas, in terms of what would benefit our audience the most in each column.

And now back to Miro...

Value/effort matrix following the FunRetro exercise, the facilitators input all the voted ideas into Miro using sticky notes, colour-coordinated to match the FunRetro board. The tag functionality in Miro allows you to display how many votes each idea has in the bottom corner of the sticky note. We then review each idea and plot them on a value/effort matrix. We found it useful to start with a more straightforward idea and plot subsequent ideas in relation to the previous idea. We created the matrix from scratch but again, Miro has a similar cost/benefit matrix template available.

Value/effort matrix

Fig 5. Value/effort matrix (download template). Click the image to enlarge.

Microsoft tools and how we’re using them

We understand that many organisations have security constraints and cost limitations, so the use of external software may not be feasible. In order to be innovative, you don’t necessarily need tools like Miro at your disposal. Instead, consider how you can adapt the tools you already have to collaborate effectively with your team. For example, Microsoft PowerPoint could be set up with similar templates to those described above.

Project retrospective

At Capita Software, we have done this by setting up our own project retrospective templates using Microsoft Excel. We begin the session by asking the team to reflect on their experience of the project. The first part of this activity is conducted in silence, using the chat box to share opinions on the positive aspects of the project, the issues and barriers and any untapped opportunities.

We do this together during the call, rather than requesting the group do it in their own time to avoid overloading our colleagues and to allow them the time needed to reflect. This process allows everyone to raise their points, provides opportunity for those who are less likely to participate in a verbal discussion and helps make sure that a more senior colleague’s viewpoint does not steer the opinions of the group.

With screen-sharing turned on, the facilitator copies all the opinions across to individual cells in a Microsoft Excel spreadsheet. They then colour-code each point in pink (positive), blue (negative) and green (potential opportunities). As a team, we run through each colour group and ask the person who made the point to elaborate. This activity ensures each person has the opportunity to share their experience and allows everyone to concentrate on listening.

Project retrospective diagram

Fig 6. Project retrospective diagram. Click the image to enlarge.

To reveal patterns and identify potential areas for improvement, we take an opinion and place this on a PowerPoint slide. We then take turns to place similar items in proximity. As each note gets added and rearranged, we start labelling the groupings. The team is asked to ensure the name of the group can be a standalone insight with learnings. As a group, we then select the themes to address in the next project.

Overcoming the challenges of remote collaboration

The adoption of any new software or process can be overwhelming or intimidating to some. The SARAH model of change (Shock, Anger/Anxiety, Resistance, Acceptance and Hope) shows the different emotions people go through, as they adapt to new ways of working. With this in mind, we can tailor how we communicate and collaborate with others. For example, introducing the task beforehand, via email, can be helpful in managing expectations. Use this as an opportunity to let your colleagues know that they can come to you with any questions before the session.

During the session, ensure everyone feels confident in what they need to do, by again asking them if they have any questions. At the end of the session, explain how this work will inform your project and outline next steps. Share any visuals with the wider team straight after the session and act quickly on next steps to keep up momentum and maintain enthusiasm.

‘The pre-workshop communication and task introductions ensured that participants were coming informed and prepared to engage fully in the session. Having a swift turnaround of the workshop materials added to the experience: having sight of the finished visual so you could formulate thoughts and reflect was so beneficial.’ - Health Services Engagement team, British Heart Foundation

Making sure everyone is heard

At the start of the session, be sure to promote the use of the chat functionality. Let your group know that they can comment at any point during the session, so that their expertise isn’t lost. We found that our sessions usually required two facilitators: one to guide the exercise and the other to keep time and monitor participation. The second facilitator can keep an eye-out for messages and raise them in the session, requesting elaboration if required. Microsoft Teams has now launched a ‘raise your hand’ feature that could also be flagged at the start of the session.

Splitting into smaller groups

When holding larger workshops or workshops that are longer than an hour, consider splitting into smaller discussion groups. After briefing all attendees on a Microsoft Teams call, we divide our team into smaller groups of around five. Half the group remain on the original call and the other half hang-up and join a second call that runs simultaneously. Make sure a second call is set up before the transition. Alternatively, Zoom allows you to split into separate ‘breakout rooms’, which simplifies this process.

Reflecting on the effectiveness of your workshop

After each session, the facilitators should evaluate how the meeting went. At Capita Software, we identify one positive, one negative and one potential opportunity from the session. Next, we rate ourselves from 1 to 4 on the selection, application, outcome and documentation - noting any lessons learned:

  • The selection is rated on whether we chose appropriate templates and tools for the session.
  • The application is rated on how well we explained, delivered and tailored the template and digital tools.
  • The outcome is rated on whether we achieved what we intended when planning the session and where we look at participant feedback.
  • The documentation is rated on whether the workshop results are shared in a way that can be acted-upon.

This co-evaluation allows us to celebrate our successes and helps us to improve the way we run virtual collaboration workshops.

Conclusion

In this article, we explained how we conduct virtual workshops and capture audience insights, illustrate customer journeys, conduct competitor analysis, prioritise ideas and learn from project retrospectives. We demonstrated how we use Miro, FunRetro and Microsoft packages, highlighting the functionality that we’ve found particularly helpful. We then shared how Capita Software and the British Heart Foundation are overcoming common challenges. Now it’s your turn to get out your virtual sticky notes and start collaborating!

About the authors

Kay Hardy is a Senior Consultant in Business Analysis at Capita Software. She will be speaking at the IRM Business Analysis Conference Europe 2020 and DREAM20 Dutch Requirements Engineering and Management. In 2019, she also presented for IIBA UK in Coventry and Leeds as well as the IRM Business Analysis Conference Europe. See Kay on LinkedIn.

Deborah Garfen is a Product Designer living and working in London. She currently works at the British Heart Foundation and has a passion for great user experiences. She recently wrote five ways charities can use gamification for good for The Brand Blog which supports charities by sharing expertise across the industry. See Deborah’s website. See Deborah on LinkedIn.