Employment characteristics
Self-employment
During 2020, it is estimated that 13% of all UK workers and 10% of IT specialists were working on a self-employed basis, and for both groups of workers, the incidence of self-employment was found to be higher amongst individuals that were from ethnic minority groups - 13% in the case of IT specialists and 18% amongst the wider workforce.
Ethnicity and the incidence of self-employment (2020)
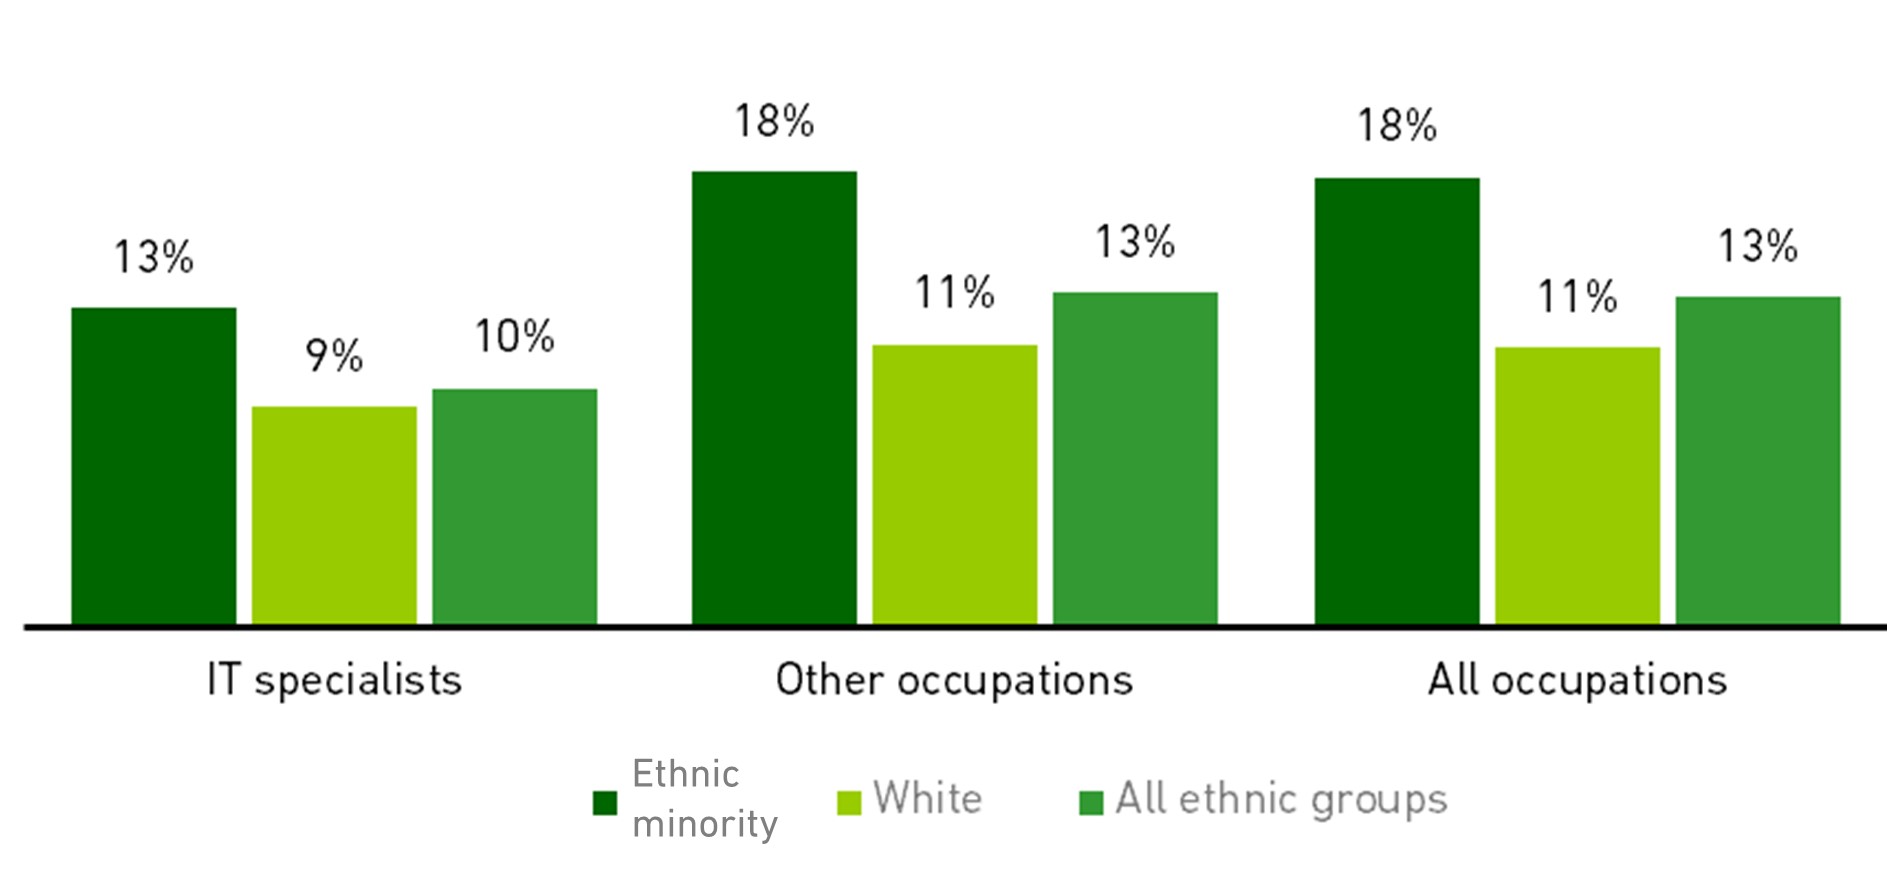
Source: Analysis of ONS Quarterly Labour Force Survey by BCS
Employees and size of workplace
IT specialists working as employees are, perhaps understandably, more likely than others to be employed within larger workplaces[2] (i.e., as micro / small sites are less likely to have an in-house function) and whilst just 29% of UK employees as a whole were working in larger sites during 2020 (those with 250 or more staff), a figure of 43% was recorded for IT specialist employees.
However, the figure was still higher amongst ethnic minority IT specialists, of which 55% were employed in workplaces with 250 or more staff.
Also notable in the chart below is the fact that ethnic minority IT specialists were much less likely to be working at micro sites than other IT staff - comparison figures in this case being 10% for ethnic minority specialists and 15% for other IT staff.
Ethnicity and size of workplace (2020)
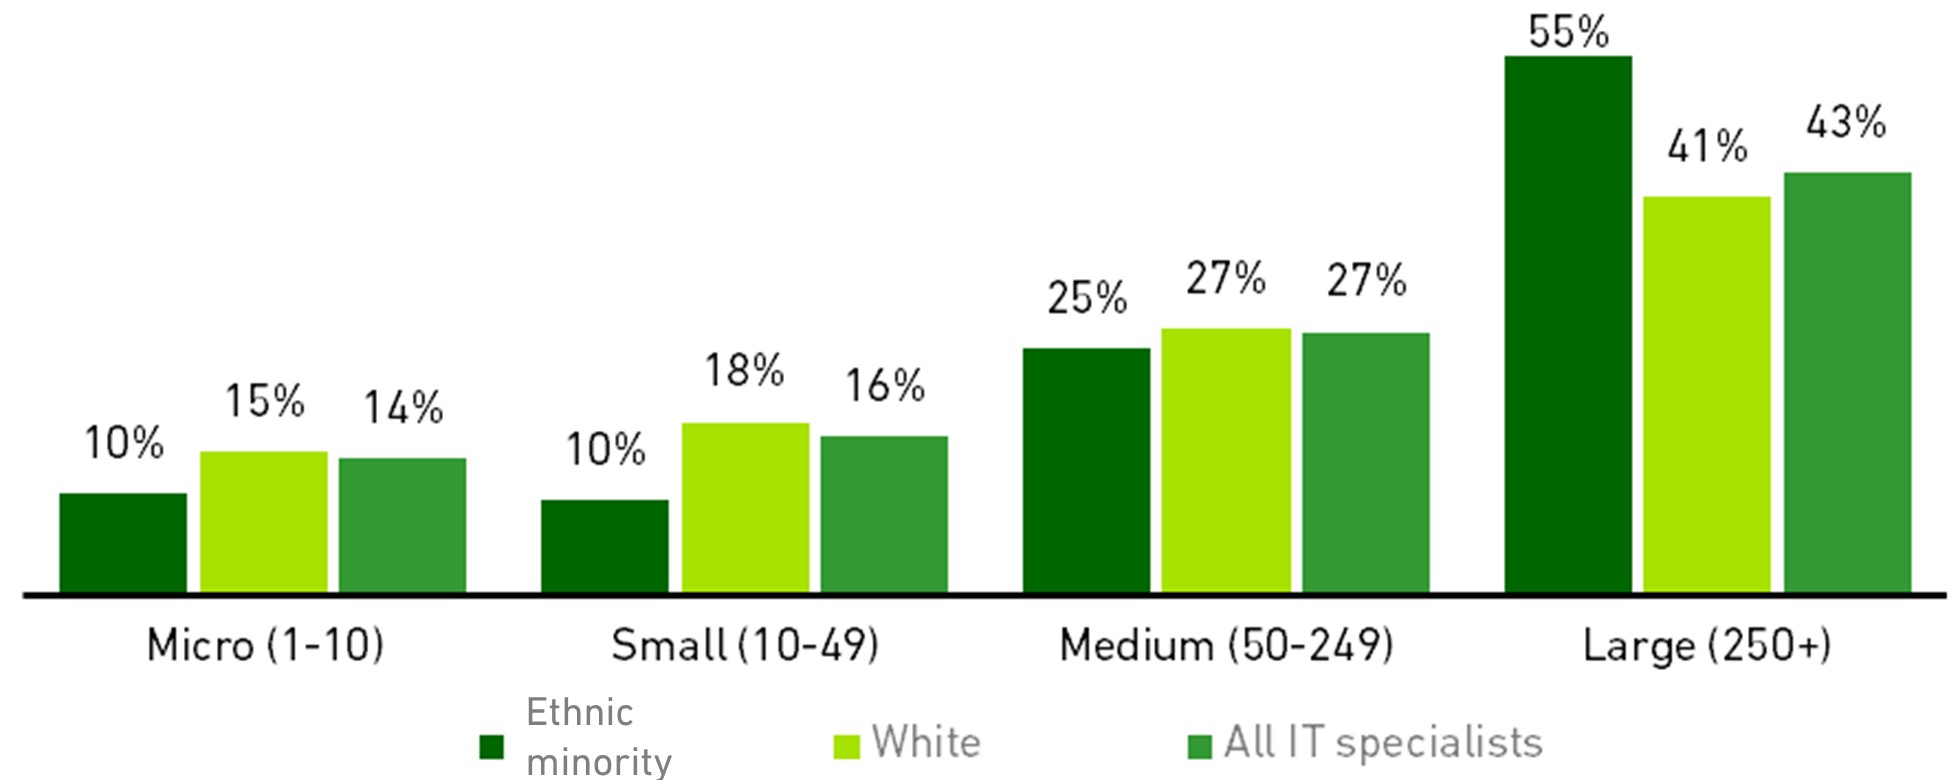
Source: Analysis of ONS Quarterly Labour Force Survey by BCS
Industry of employment
Just over one half (52%) of all ethnic minority IT specialists were working in IT businesses in 2020 - a higher proportion than for those of white ethnic origin (45%) and IT specialists as a whole (47% of whom were working in IT firms during this period).
After IT, the next largest employer of IT specialists (ethnic minority / white) were banking/finance firms (22% and 20% respectively) and the public sector (10% and 13%).
When considering levels of representation, however, distribution/hotel/restaurant employers exhibited the highest levels for ethnic minority IT specialists (23%) followed by the IT sector (21%) and banking/finance employers (20%).
Conversely, the level of ethnic minority representation amongst IT staff was lowest within the manufacturing sector, where just 8% of IT specialists were from ethnic minority groups.
Ethnic minority employees by occupation and industry (2020)
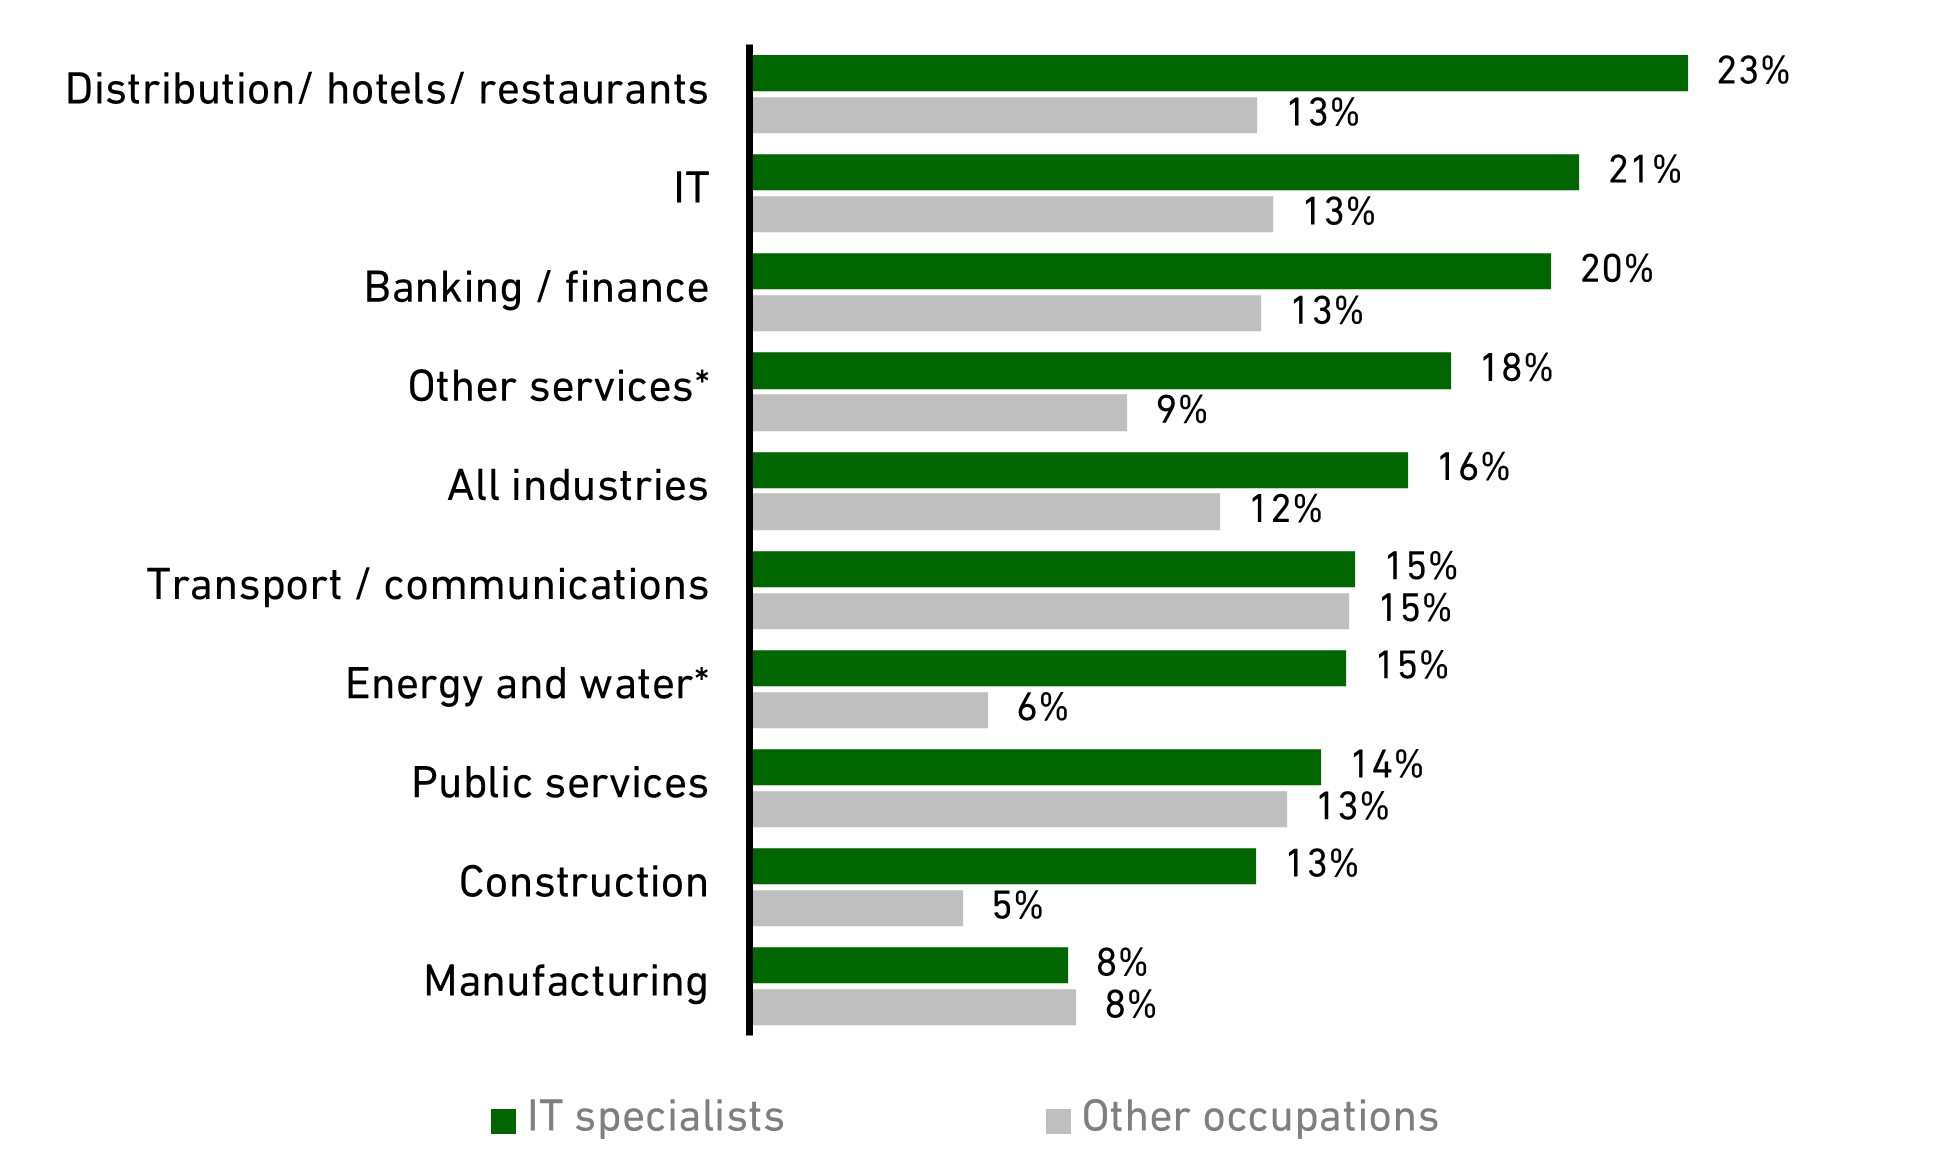
Source: Analysis of ONS Quarterly Labour Force Survey by BCS
* Five-year average
[2]The LFS asks individuals about the number of employees at their workplace as opposed to enterprise / organisation as a whole.