Ethnicity and IT employment
There were 300,000 IT specialists in the UK from ethnic minority groups in 2020, representing 18% of all IT specialists in the UK at that time - a notably higher level of representation than for the workforce as a whole (12%).
Moreover, the level of representation amongst IT specialists has slowly been rising over the past five years as illustrated in the chart below:
Trends in workforce representation (2016-20)
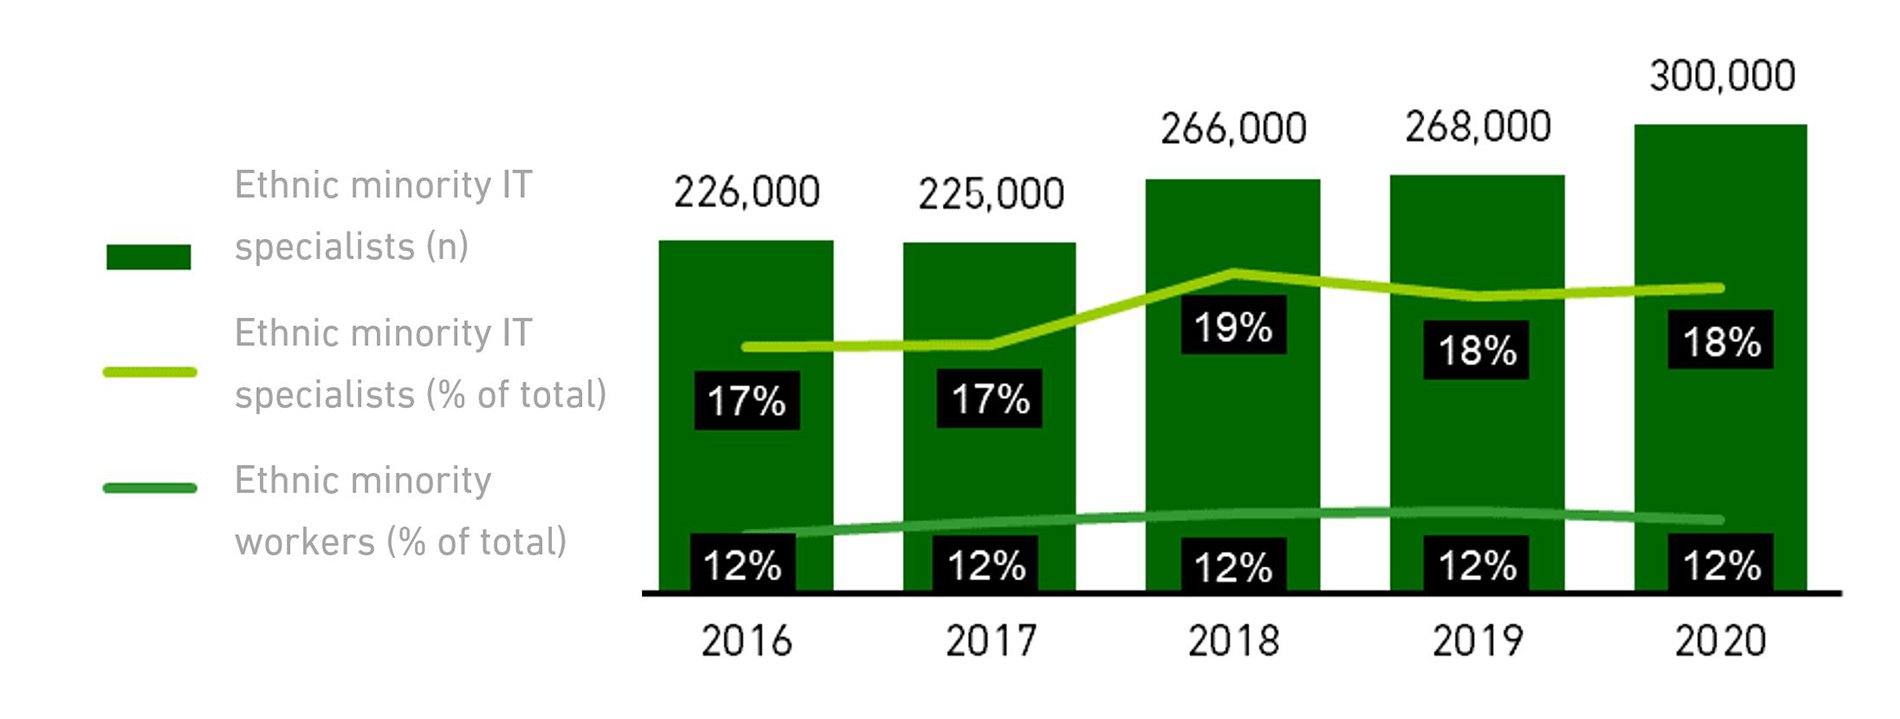
Source: Analysis of ONS Quarterly Labour Force Survey by BCS
Ethnicity in IT explored
Amongst IT specialists from ethnic minority groups, representation is highest for those whose ethnicity is Indian (9%) - this group is almost three times as prominent amongst IT specialists as within the workforce as a whole (3%) in 2020.
Ethnicity in the workforce (2020)
| Ethnicity | IT specialists |
Other occupations |
All occupations |
|---|---|---|---|
| White | 82% | 88% | 88% |
| Non-white | 18% | 12% | 12% |
| Indian | 9% | 3% | 3% |
| Pakistani/Bangladeshi | 2% | 2% | 2% |
| Chinese | 1% | 1% | 1% |
| Other Asian | 1% | 1% | 1% |
| Black/African/Caribbean/Black British | 2% | 3% | 3% |
| Other ethnic group | 1% | 1% | 1% |
Source: Analysis of ONS Quarterly Labour Force Survey by BCS
Representation across the UK
Representation of individuals from ethnic minority groups amongst the IT professions varies significantly across the UK - from just 4% in Northern Ireland to 32% in London. In all nations / regions, however, the proportion of IT specialists from ethnic minority groups is higher than that recorded within the workforce as a whole (i.e., during 2020).
Workforce representation by nation / region (2020)
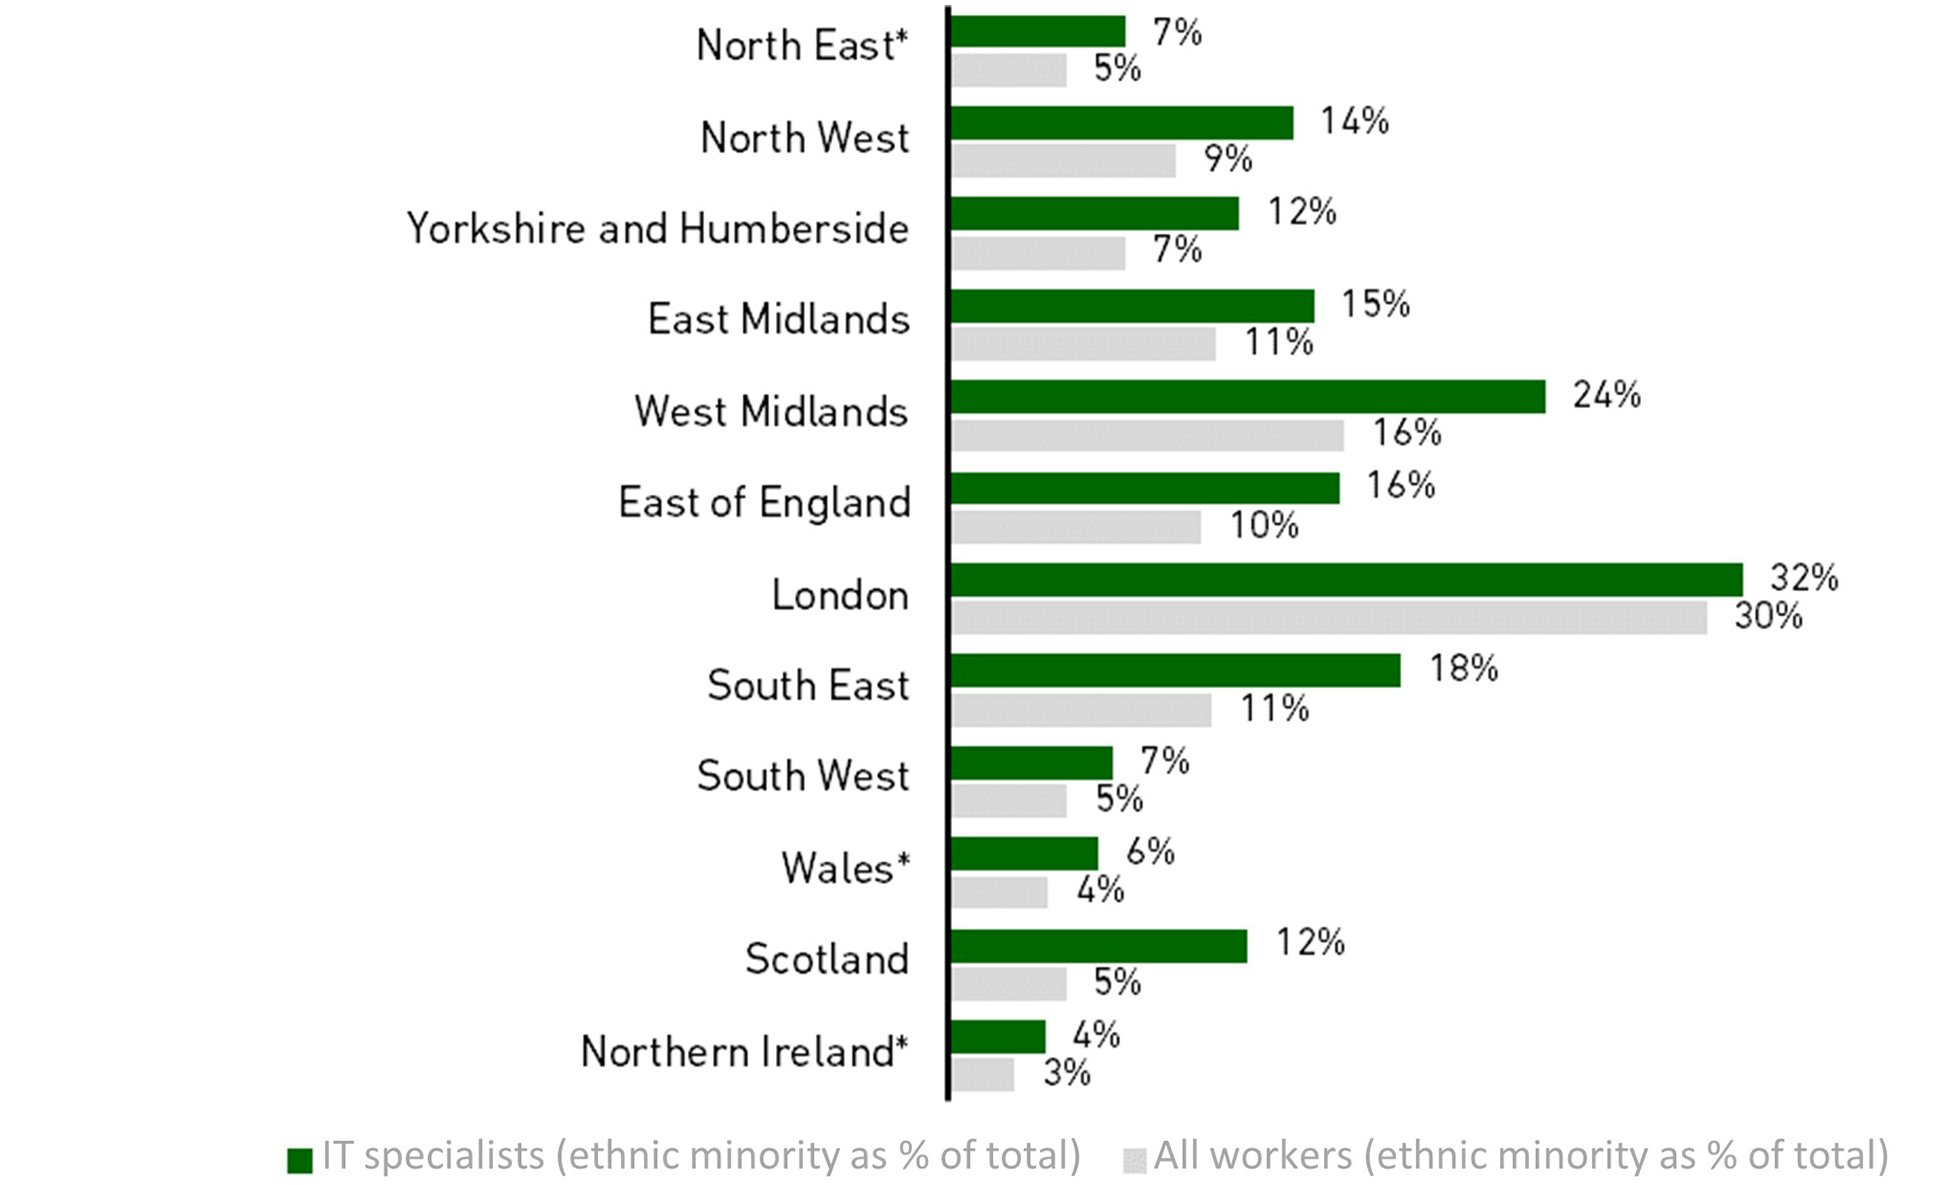
Source: Analysis of ONS Quarterly Labour Force Survey by BCS
* Five-year average