Ethnicity in context, labour market overview
There were 5.6m people of working age in the UK that were from ethnic minority groups in 2020 i.e., 14% of the total working age population at that time.
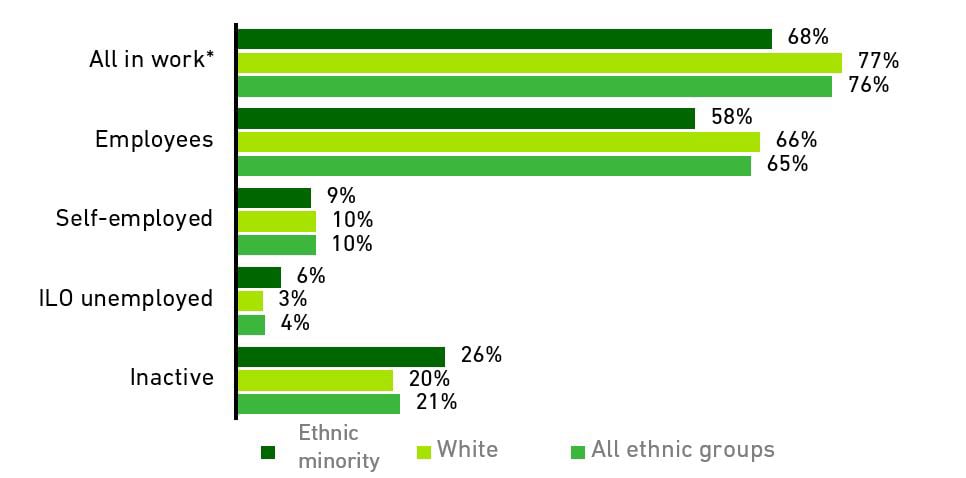
Of these, 68% were in work, 26% were classed as ‘inactive’ and 6% were unemployed (compared with figures of 76%, 21% and 4% respectively for those of white ethnicity).
Ethnicity and economic activity of the working aged population (2020)
Source: Analysis of ONS Quarterly Labour Force Survey by BCS
* includes a small number of individuals in work but not as employees / self-employed (i.e., <1% of the total)
Given that they accounted for 14% of the working age population, the proportion of individuals in work accounted for by ethnic minority groups was slightly lower than expected (12%) as was the case amongst employees (12%) and the self-employed workers (13%).
Unfortunately, however, the level of representation for ethnic minority groups was much higher when considering individuals that were either unemployed (i.e., 21% of the total) or economically inactive (17%).