Ethnicity and IT employment
There were 376,000 IT specialists in the UK from BAME groups in 2022, representing 20% of all IT specialists in the UK at that time – a notably higher level of representation than for the workforce as a whole (15%). Moreover, the level of BAME representation amongst IT specialists has remained consistently above the norm throughout the past five years as illustrated in the chart below:
Trends in workforce representation (2018-22)
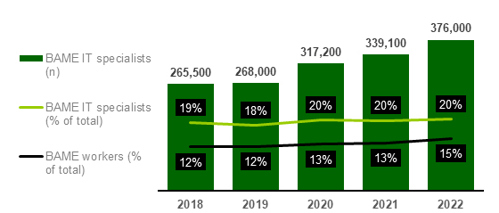
Source: Analysis of ONS Quarterly Labour Force Survey by BCS
Ethnicity in IT explored
Amongst IT specialists from BAME ethnic groups, representation is highest for those whose ethnicity is Indian (8%) – this group almost three times as prominent amongst IT specialists as within the workforce as a whole (3%) in 2022.
Ethnicity in the workforce (2022)
| Ethnicity | IT specialists |
Other occupations |
All occupations |
|---|---|---|---|
| White | 80% | 86% | 85% |
| BAME | 20% | 14% | 15% |
| Indian | 8% | 3% | 3% |
| Black/African/Caribbean/Black British | 3% | 3% | 3% |
| Mixed/Multiple ethnic groups | 2% | 2% | 2% |
| Other ethnic group | 7% | 6% | 6% |
Source: Analysis of ONS Quarterly Labour Force Survey by BCS
Deeper dive on ethnicity splits
Representation across the UK
Representation of individuals from BAME ethnic groups amongst the IT professions varies significantly across the UK - from just 5% in the North East, Wales and Northern Ireland (5-year averages) to 36% in London. Within all nations/regions however, the proportion of IT specialists from BAME groups is higher than that recorded within the workforce as a whole for that area of the UK (i.e. during 2022).
Workforce representation by nation / region (2022)
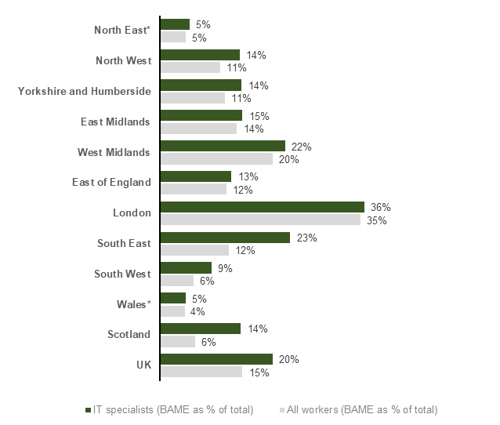
Source: Analysis of ONS Quarterly Labour Force Survey by BCS
* Five-year average