Gender and IT employment
There were 380,000 female IT specialists in the UK workforce during 2022 - 20% of the total at that time. As illustrated in the chart below, the level of female representation in IT has increased marginally over the past five years though steadily since 2019. That said, female representation remains well below the level observed within the workforce as a whole (48%).
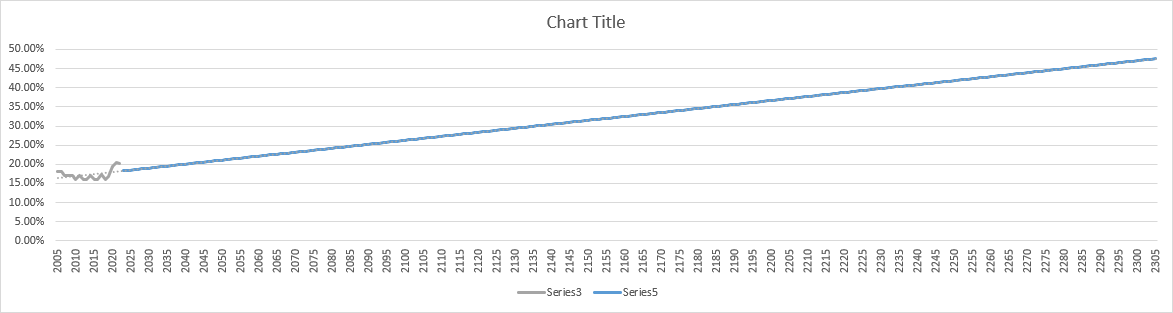
If progress continues at the rates recorded in recent years it would take around 283 years for female representation in IT to reach the current level recorded within the wider workforce.
Extrapolation of time taken for women’s representation in the IT workforce achieve parity with men’s
Click to view larger image
Trends in workforce representation (2018-20)

Source: Analysis of ONS Quarterly Labour Force Survey by BCS
If the level of representation for female workers in IT specialist positions was equal to that amongst the working age population as a whole during 2022, there would have been an additional 527,000 in IT roles in the UK.
Representation across the UK
Amongst the UK nations/regions, the North East and the East Midlands were associated with the lowest level of female representation amongst IT specialists in 2022 and at that time, just 16% in these areas were women. By contrast, Scotland, the West Midlands and the South East displayed the best ‘gender balance’, with women accounting for 23% of IT specialists in each of these areas.
Workforce gender representation by nation / region (2022)
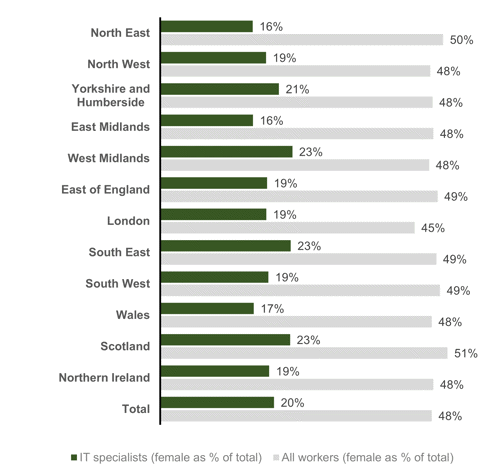
Source: Analysis of ONS Quarterly Labour Force Survey by BCS